Financial Reporting Features & Tools
Self-service financial reporting and planning in just a few clicks.
What is Reach Reporting? Reach Reporting is a financial reporting and planning platform for accountants that automates dashboards, templates, and budgeting from QuickBooks, Xero, and spreadsheets.
Integration & Automation
- QuickBooks Online & Desktop integration
- Xero integration
- CSV trial balance integration
- Gusto integration
- Datasheets integration & Google Sheets
![]()
Great app integration!
Daysi – QuickBooks Online User
Intuitive Customization
- Spreadsheet environment
- Excel-like formulas
- Metric goals/ targets
- Trend lines
- See how powerful customization is
![]()
Best QuickBooks API For Financial Reporting
Agency CFO – QuickBooks Online User
“The best financial reporting API software, full stop. This is a “must have” for accountants focused on advisory services.”
Data Storytelling
- Live text
- Conditional formatting
- Dynamic statements & interactive metrics
- Custom themes for branding and colors
- Make a difference with data storytelling
![]()
Intuitive and Easy
Jake F. – QuickBooks Online User
“Reach is very intuitive and easy when creating visualizations, dashboards, and reports to make sense of your numbers!”
Template Library
- Pre-built report & dashboard templates
- Fully customizable
- Best practice metrics
- Actuals & variance analysis
- Rolling forecast & budget analysis templates
- Explore the template library
![]()
They Get It
Kenneth – QuickBooks Online User
“Reach Reporting is so flexible that there is always a way to get the exact type of reporting that you need.”
Budget & Forecasting
- Minimal learning curve
- Forecasting algorithms & custom formulas
- Datasheets for non-financial data
- Planning trend visualizations
![]()
Great app – amazing reporting
Tyler W. – QuickBooks Online User
“Provides beautiful summarized reports, and dashboarding, along with budgets and forecasting data.”

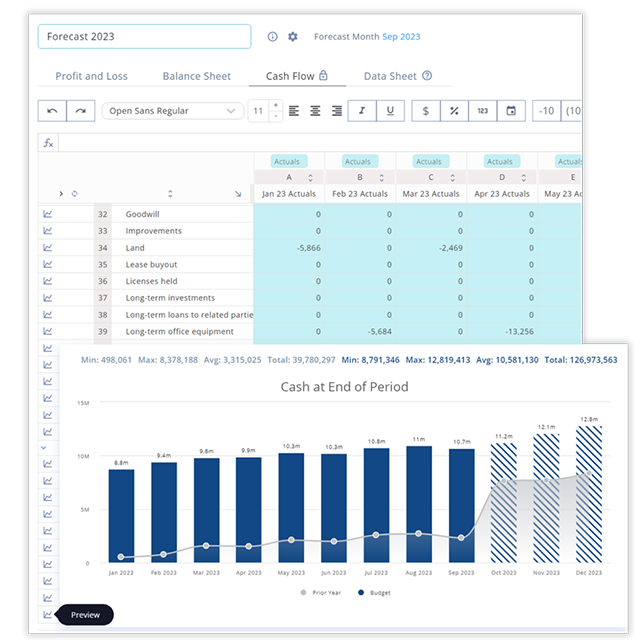
Integrated 3-Way Planning
- A complete picture of a business trajectory
- Connected P&L, Balance Sheet & Cash Flow Statement
- Automated cash flow forecast
- Makes complex planning simple
- Plan scenarios with 3-way forecasting
![]()
Great Reports; Huge Time-Saver!
Cathy – QuickBooks Online User
“The ability to compare to budget and also report on Classes is also great! I save hours of work each month!”
Multi-Business Consolidation
- Multi-currency consolidation
- Easy eliminations
- Filter by company
![]()
A great solution for consolidation
Amanda – QuickBooks Online User
“I use Reach to consolidate my 5 QuickBooks Online accounts each month- this is a huge time saver once you’ve figured out how to work the platform. The pre-made report options help make all my client reports look much more professional than QuickBooks Online alone.
Client Portal
- Organize your reports and dashboards
- Determine access levels using folders
- Upload files such as .pdf, .xlsx, .xls, .xlsm, .docx, .doc, .csv
- Unlimited users and clients
- See how easy it is to use the Client Portal
![]()
Intuitive and Easy
Michaela N. – QuickBooks Online User
“Now, financial reporting takes a few minutes. Reach allows me to focus on other things.”
AI Supercharged Reporting
- Identify trends, variances, and relationships
- Deep insights without a financial analyst
- Gain business-specific, expert-level analysis
- Get tailored reports and dashboards
- Make data-driven decisions with confidence
- See how AI financial reporting works
![]()
Plus AI! Amazing
Jared – QuickBooks Online User
“Just one click, and the financials are broken down into bite-sized paragraphs that I can send to my client or paste in a report. I look like a financial wizard to my clients.”
Testimonials
People also asked
How does Reach Reporting handle budgeting and forecasting?
Reach Reporting simplifies budgeting and forecasting with a 3-way forecasting tool that allows users to set financial goals, create budgets, and forecast future performance. By analyzing historical data and trends, the software helps businesses make informed predictions and plan effectively for the future. Accountants who modernize their processes consistently outperform peers, according to research from CPA Australia.
Is Reach Reporting suitable for small businesses?
Yes, Reach Reporting is suitable for businesses of all sizes, including small businesses. Its scalable features and user-friendly interface make it accessible to small business owners who need powerful reporting tools without the complexity or high cost associated with enterprise-level solutions.
How can I start using Reach Reporting?
Getting started with Reach Reporting is simple. Users can sign up for a free trial on the Reach Reporting website to explore the software’s features and capabilities. The intuitive setup process and user-friendly interface make it easy to begin creating impactful financial reports right away. Read more Presentations your clients won't forget.
Can Reach Reporting handle multi-entity consolidations?
Yes, Reach Reporting can handle multi-entity consolidations. The software allows users to consolidate financial data from multiple entities into a single report, providing a comprehensive view of the overall financial health of the organization.
Can Reach Reporting help with compliance and regulatory reporting?
Yes, Reach Reporting can help with compliance and regulatory reporting by providing templates and tools that align with various regulatory standards. This ensures that all financial reports meet necessary compliance requirements.


“This app has helped me organize and visualize financial data in a way that helps each department understand its performance.”