Visualizing Financial Data with Reach Reporting
Visualizing financial data is an essential skill for modern financial professionals. Effective data visualization turns complex numbers into clear, actionable insights that drive better decision-making. Here’s how Reach Reporting can help you achieve this:
The Power of Data Visualization
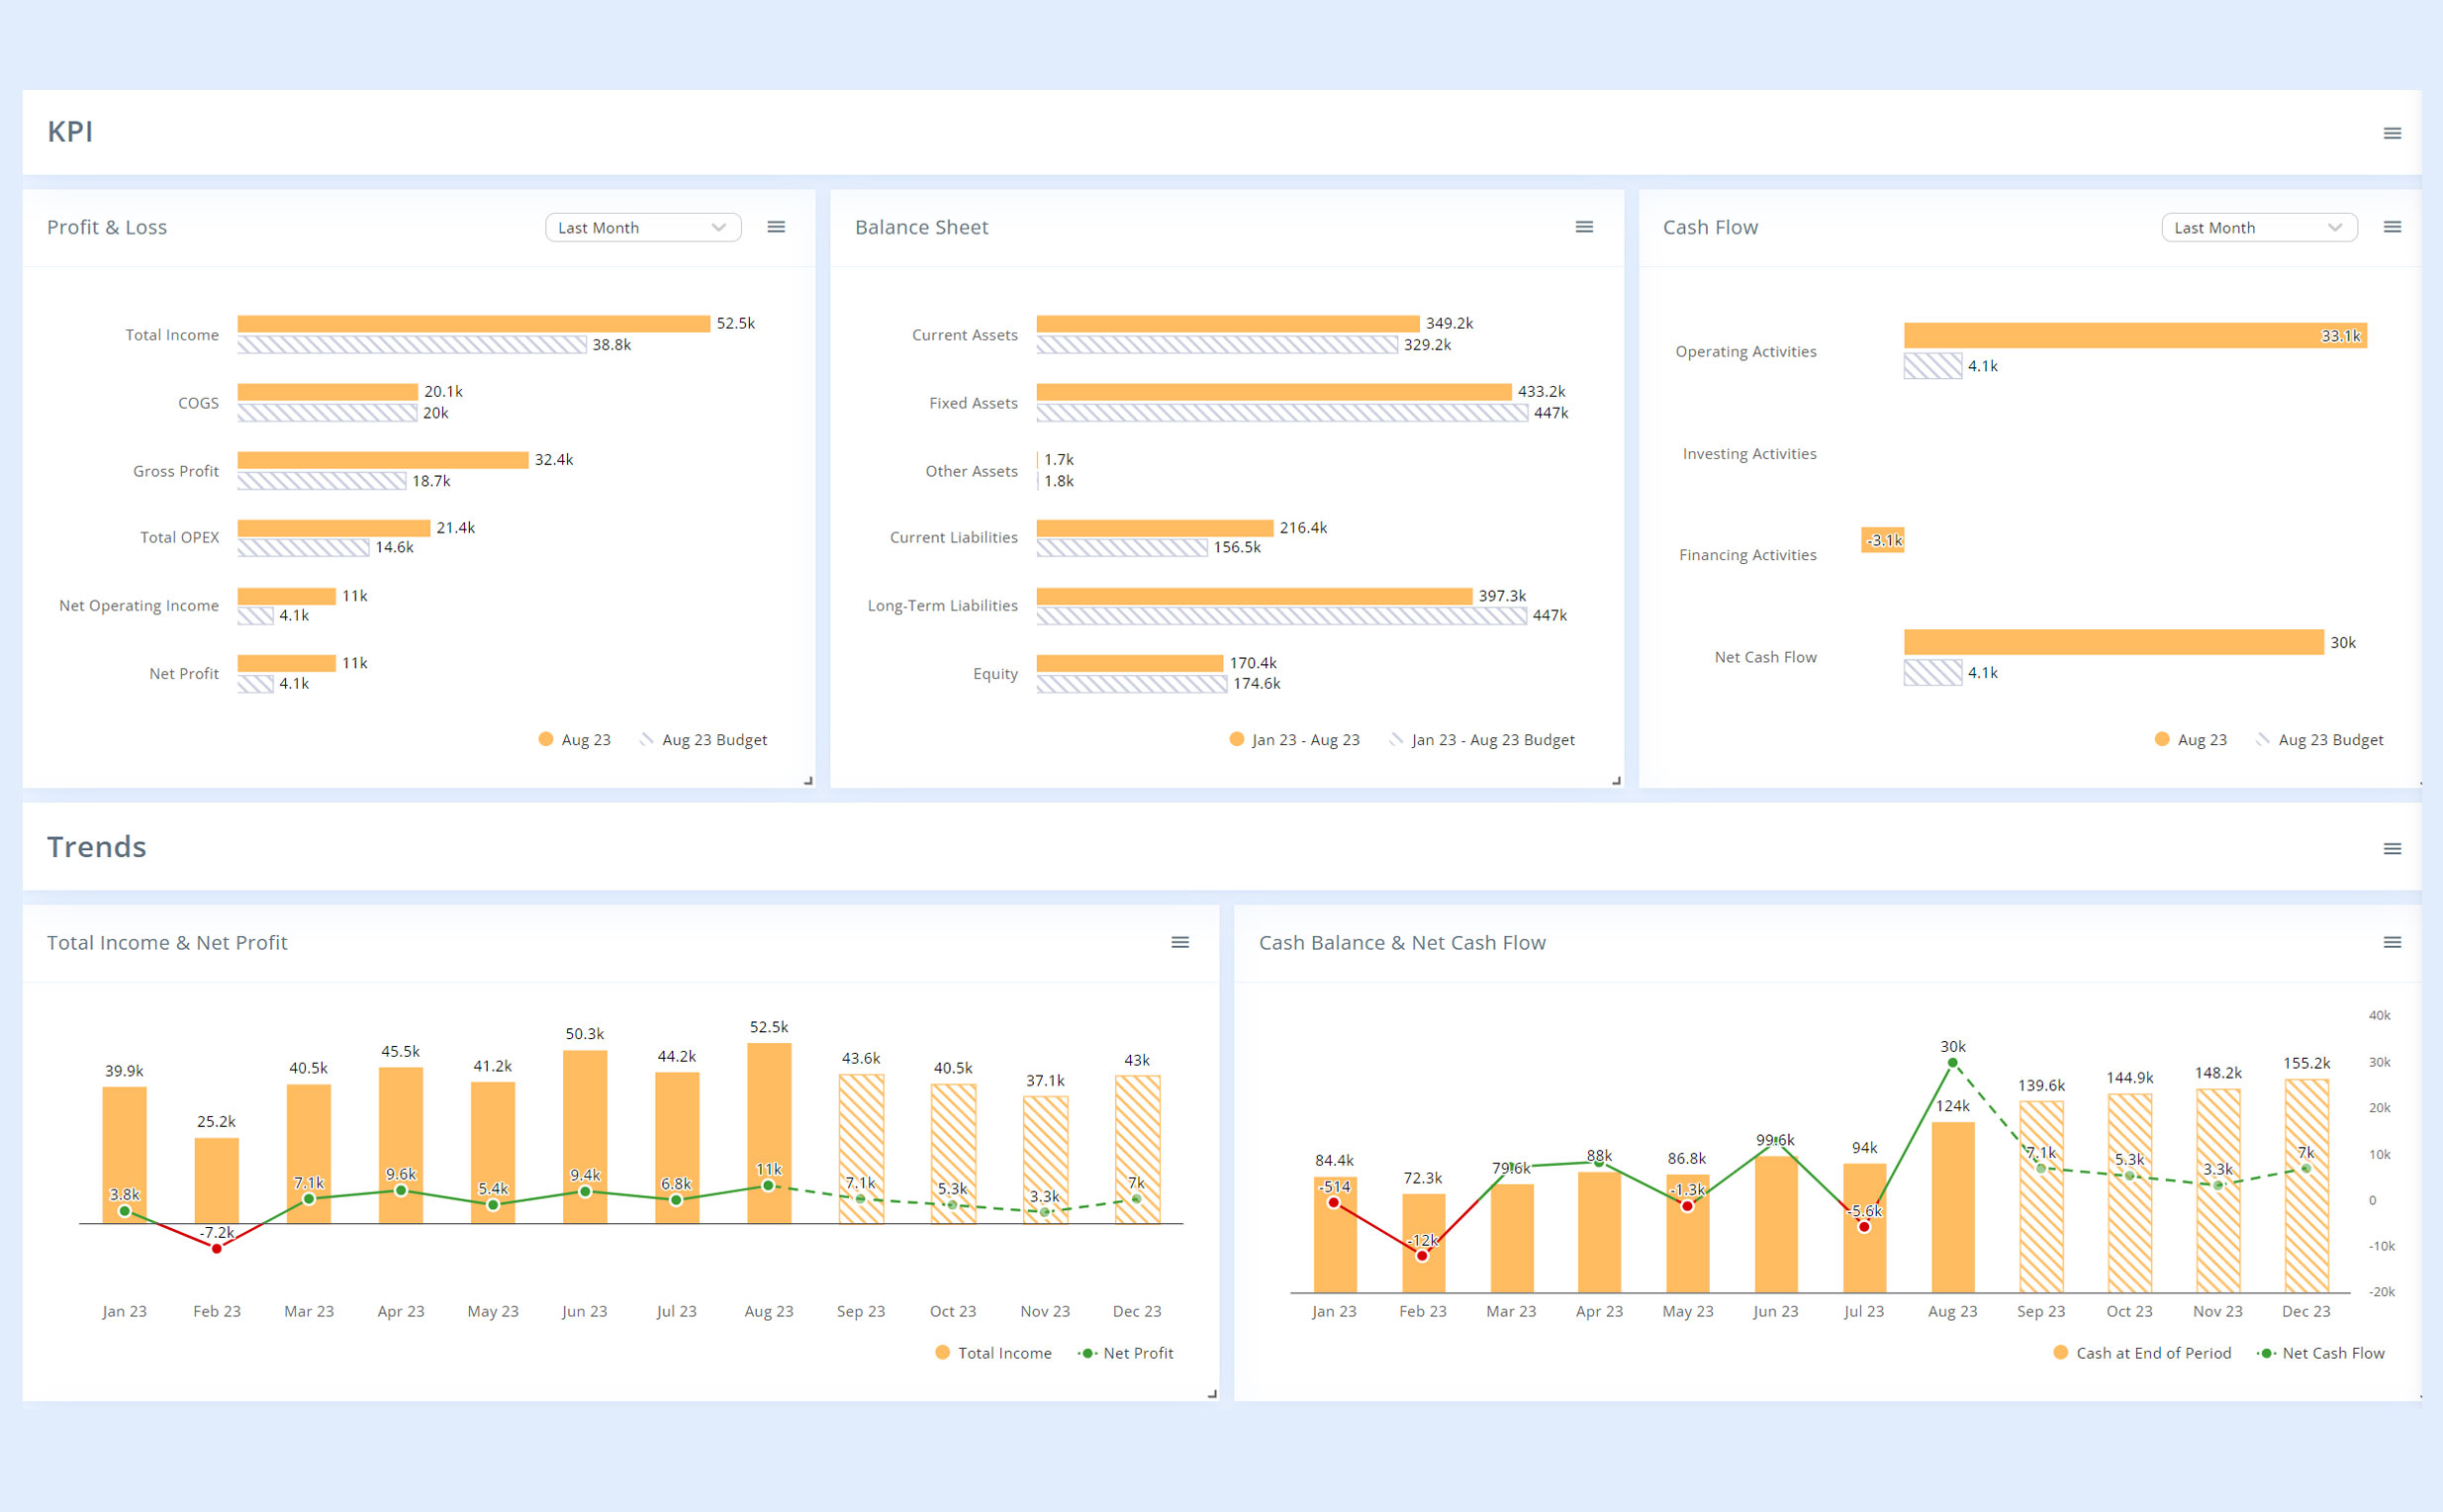
Financial data, when visualized effectively, allows stakeholders to quickly grasp key insights, identify trends, and make informed decisions. Reach Reporting offers visualization tools that transform raw data into impactful charts, graphs, and dashboards.
Best Practices for Visualizing Financial Data
- Simplify Complex Data: Break down complicated datasets into simple, understandable visualizations. Reach Reporting allows you to customize visuals, ensuring that key information is easily accessible to your audience.
- Highlight Key Metrics: Focus on the metrics that matter most to your business. Reach Reporting enables you to prioritize and showcase critical data points, helping you keep your audience engaged and informed.
- Use the Right Visuals: Choose the appropriate chart type for your data. Whether it’s bar charts for comparisons, line charts for trends, or pie charts for proportions, Reach Reporting provides versatile options tailored to your needs.
- Tell a Story with Data: Data alone isn’t enough; the story behind the data drives action. With Reach Reporting, you can create visual narratives that guide your stakeholders through the data, highlighting insights and facilitating better decision-making.
Take a look at our Financial Reporting Templates
Reach Reporting for Effective Data Visualization
Reach Reporting empowers financial professionals with the tools to create compelling visualizations. It transforms financial data into powerful, actionable insights by simplifying complex data, highlighting key metrics, and providing the right visual formats.
Effective data visualization is crucial for conveying financial insights clearly and effectively. Reach Reporting’s powerful visualization tools can ensure that your financial data is not only accurate but also impactful, driving better business outcomes.
Ready to elevate your data visualization? Start your free trial or request a demo today to see how Reach Reporting can help you turn numbers into meaningful insights.
People Also Ask
Q: What are the best practices for visualizing financial data?
A: Best practices include simplifying complex data, highlighting key metrics, using the right visual formats, and telling a compelling data story. Learn more about visualizing financial data.
Q: How does Reach Reporting improve data visualization?
A: Reach Reporting offers customizable tools that help you create clear, impactful visualizations tailored to your audience’s needs. Discover how Reach Reporting enhances data visualization.
Q: Why is storytelling important in data visualization?
A: Storytelling with data helps transform raw numbers into insights that are easy to understand and act upon.

