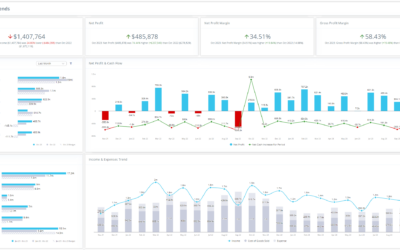
Track and Optimize Business Performance Looking for a Performance Analysis Report Template to help...
Quarterly Financial Report Templates
Stay on Track Every Quarter Looking for Quarterly Financial Report Templates? These templates...
Monthly Financial Report Templates
Stay on Top of Your Financial Performance Looking for comprehensive Monthly Financial Report...
How Capital Allocation Impacts Business Growth
Capital allocation refers to how a business distributes its financial resources across various...
The Importance of Performance Monitoring in Strategic Financial Planning
In the dynamic business world, strategic financial planning is the backbone of sustainable growth...
Understanding the Difference Between Monthly, Quarterly, and Annual Financial Reports
The Importance of Financial Reporting and Why Every Business Needs Them Financial reports are the...
The Evolution of Financial Reporting
A Changing Landscape Financial reporting has significantly transformed, adapting to modern...
How to Prepare Financial Statements Under IFRS
Introduction to IFRS Standards International Financial Reporting Standards (IFRS) provide a...
Navigating Regulatory Changes in Financial Reporting
The Ever-Changing Landscape of Financial Reporting The regulatory landscape in financial reporting...
Reach Reporting Templates – GAAP Compliant and SOX Driven
In today’s complex financial landscape, businesses must adhere to stringent regulations to ensure...
Support the Financial Success of Clients
Why Many Small Businesses Don’t Understand Where Their Money Goes A survey revealed that 54% of...
Income Statement Template
Simplify Profitability Tracking An income statement is essential for understanding your business’s...
The Ultimate Guide to Financial Statement Templates
Customization, Flexibility, and Automation Financial statement templates are crucial for tracking...
Helping Clients Interpret the Income Statements
A Detailed Guide to Interpreting Income Statements Income statements are critical financial...
Impact of Sarbanes-Oxley on GAAP Compliance
Transforming Business Integrity: A Comprehensive Overview of Sarbanes-Oxley Act Compliance and Its...
Reach Reporting Joins Information Technology Alliance
NEWS RELEASE FOR IMMEDIATE RELEASE Reach Reporting Invited to Join the Information Technology...
Transforming a Balance Sheet into a Comprehensive Visual Presentation
A Guide for Financial Professionals Discover how to transform a traditional balance sheet into a...
Income Statement Mistakes to Avoid
Common Income Statement Mistakes to Avoid (and How to Fix Them) Accurately interpreting income...
Understanding Operating Expenses
A Comprehensive Guide for Financial Professionals Operating expenses (OPEX) are vital for any...
Understanding Net Income
A Crucial Metric for Business Success Net income, often referred to as the bottom line, is a...
The Future of Financial Compliance: Navigating the Evolving Landscape
This blog is a comprehensive, well-researched, and globally relevant analysis of the future of...
Financial Modeling Guide for Large Enterprises
Comprehensive Financial Modeling Guide Financial modeling is an indispensable tool for large...
Advanced Financial Forecasting Techniques
Financial professionals must rely on precise forecasting methods to navigate uncertainty and guide...
Budgeting Tips for Small Businesses
A Guide to Financial Success Budgeting is crucial for small businesses to ensure financial...
Data Visualization Best Practices
Creating Impactful Visuals Data visualization is a powerful tool that transforms complex data into...
Creating Effective Dashboards
Design Tips for Delivering Insights Dashboards are powerful tools for visualizing data, but they...
Developing Effective Financial Team Training Strategies
To ensure your team’s success when creating financial reports, we recommend implementing the...
Reporting Key Financial Metrics That Matter Most to Stakeholders
In financial reporting, focusing on key metrics that matter to stakeholders is essential for...
10 Tips for Timely and Accurate Financial Reporting
Ensuring the accuracy and timeliness of external financial reporting is crucial for maintaining...
Financial Reporting Challenges and Solutions
Financial reporting is a critical function for businesses, yet it comes with its own challenges,...
More articles
Navigating the One Big Beautiful Bill Act: Key Tax Changes Every CPA Needs to Know
Signed into law on July 4, 2025, H.R. 1, the One Big Beautiful Bill Act, is a beast of a reconciliation package, shaking up the tax landscape. If you're a CPA, accountant, or any other financial or tax professional guiding clients through these shifts, you probably...
Fannie Mae & Freddie Mac: What Crypto in Lending Means for Accountants and Financial Professionals
For decades, mortgage-lending institutions have operated within a well-defined, conservative framework, valuing cash, bonds, and publicly traded securities as trusted assets. But a seismic shift is underway. On June 25, 2025, the Federal Housing Finance Agency (FHFA)...
Build Multi-Location Franchise Financial Reports
Franchise Financial Reporting Series – Bonus Article Build Multi-Location Financial Franchise Reports Multi-location reporting is where franchises win or lose visibility. When done right, it becomes the most valuable financial asset a brand can have. When done poorly,...
How to Create a Consolidated Franchise Report That Makes Sense
Franchise Financial Reporting Series – Bonus Article How to Create a Consolidated Franchise Report That Makes Sense Franchise consolidation reporting shouldn’t feel like assembling IKEA furniture without the instructions. When you’re working with multiple locations,...
Knowledge Center


