COMING FROM JIRAV®?
Reporting Made Easy|3-Way Planning|Cashflow Forecasting|Extensive FP&A|Automated Monthly Close|Consolidate|Multi-Year Budgeting
in Reach Reporting
Quickly build budgets and reports in minutes instead of days or weeks.
Built for easy use in a familiar spreadsheet environment, Reach Reporting eliminates the need for a steep learning curve.
NO CREDIT CARD REQUIRED
Trusted by advisors, accountants and managers
Have your report set up in minutes.
Connect
Your Data
Integrate your accounting software or use a CSV Trial Balance to upload data.
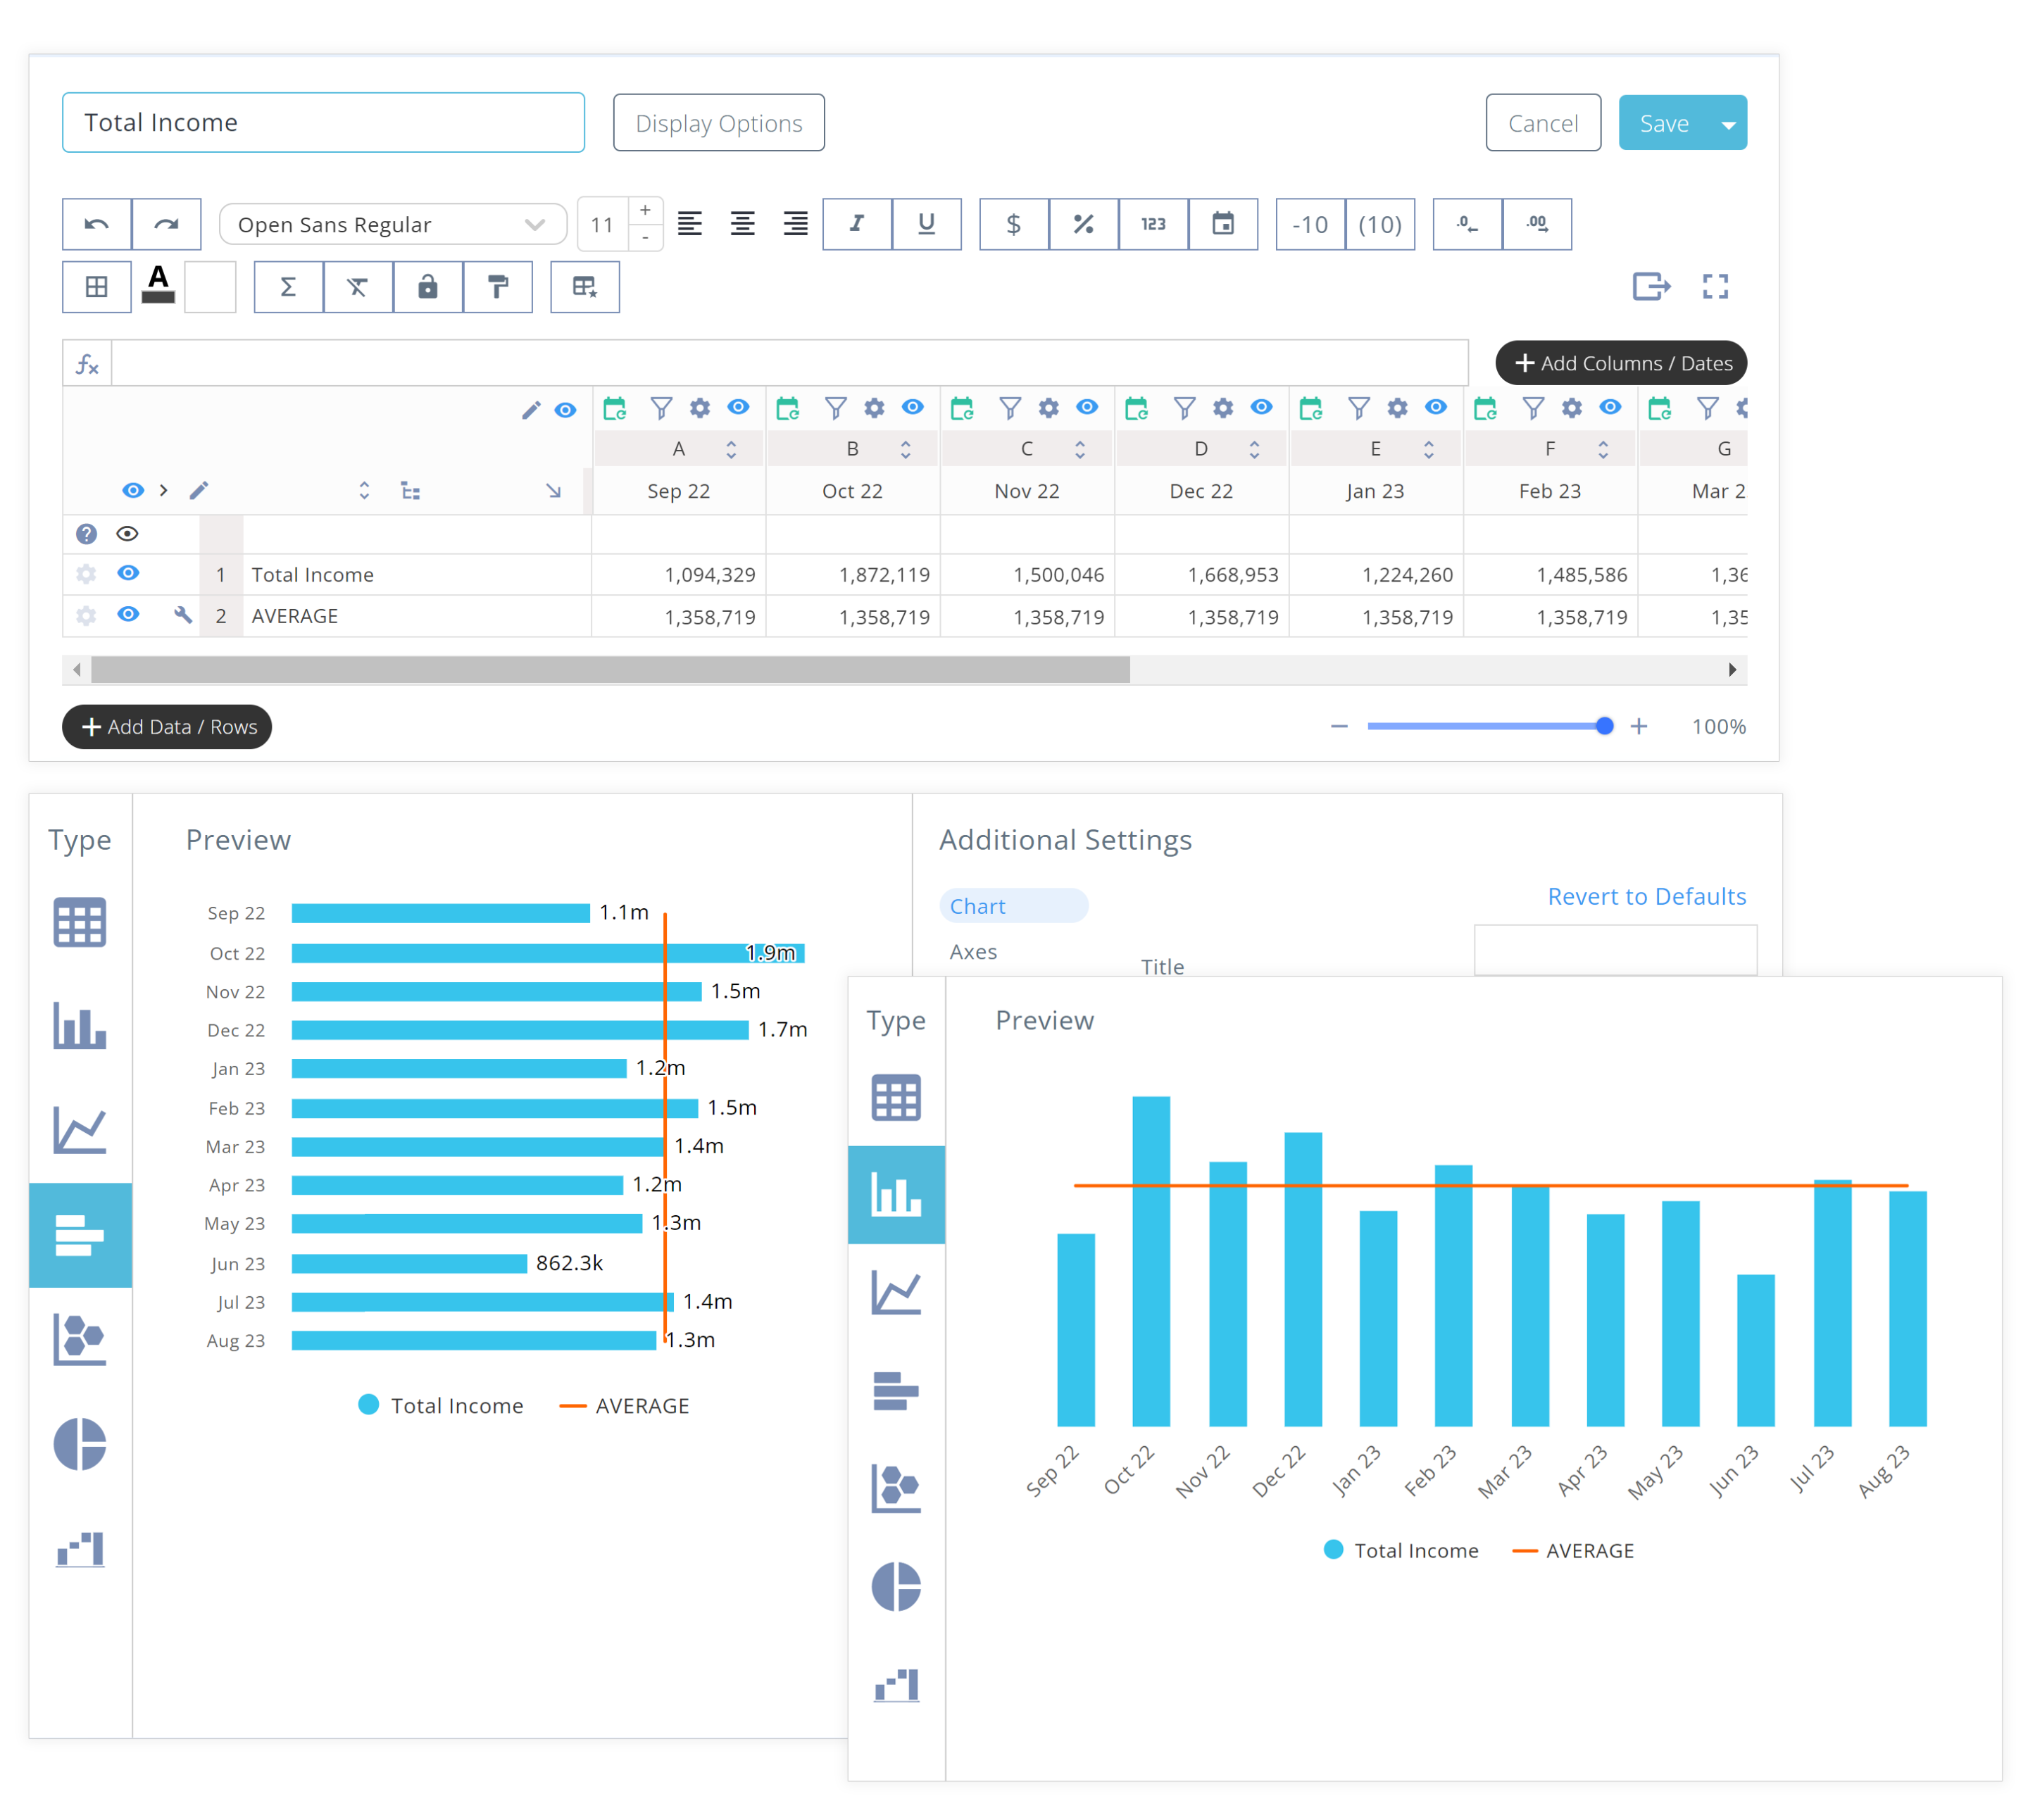
Automated & Flexible
Spreadsheets
Understanding data is critical.
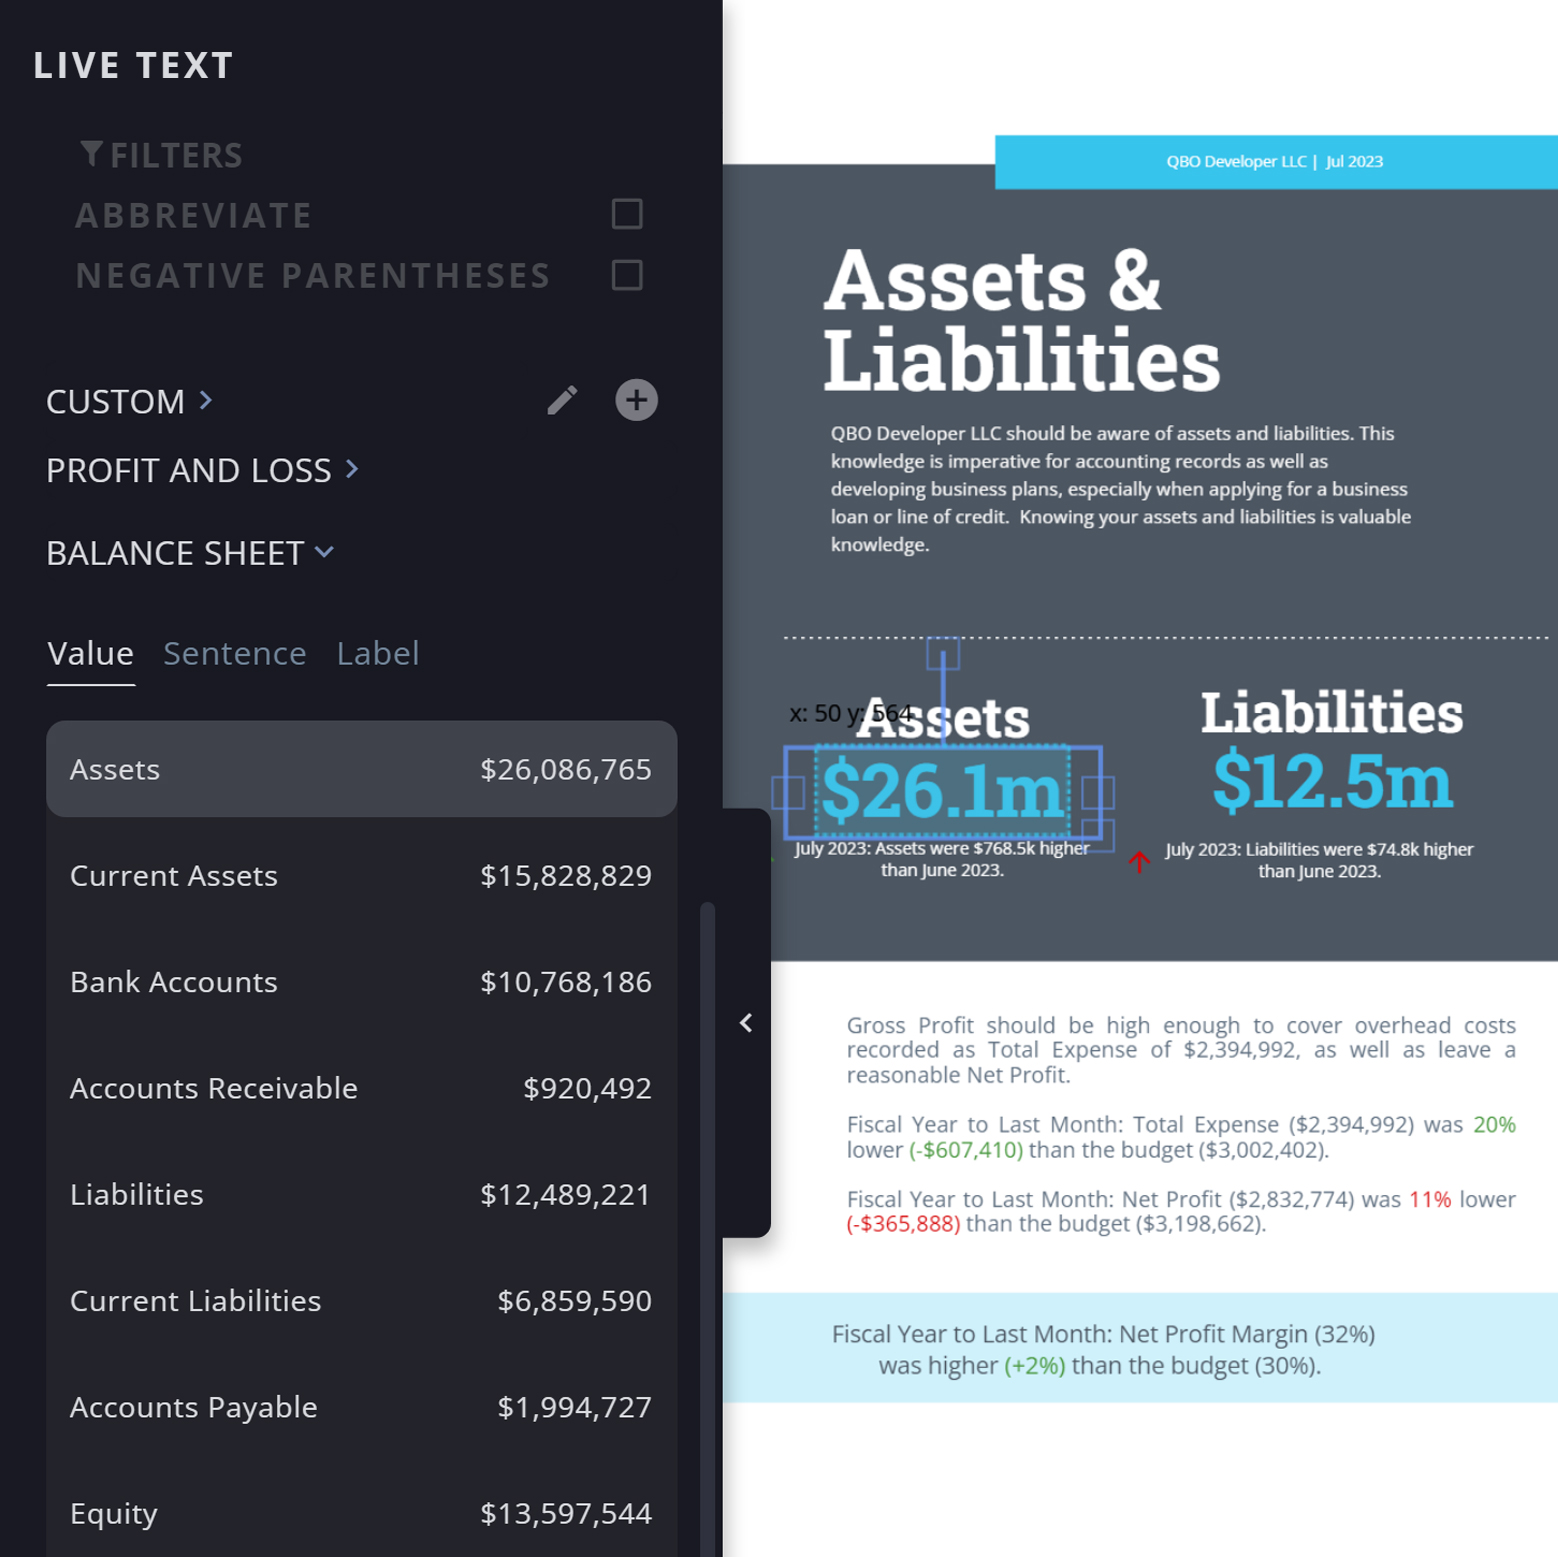
Visual Data
Storytelling
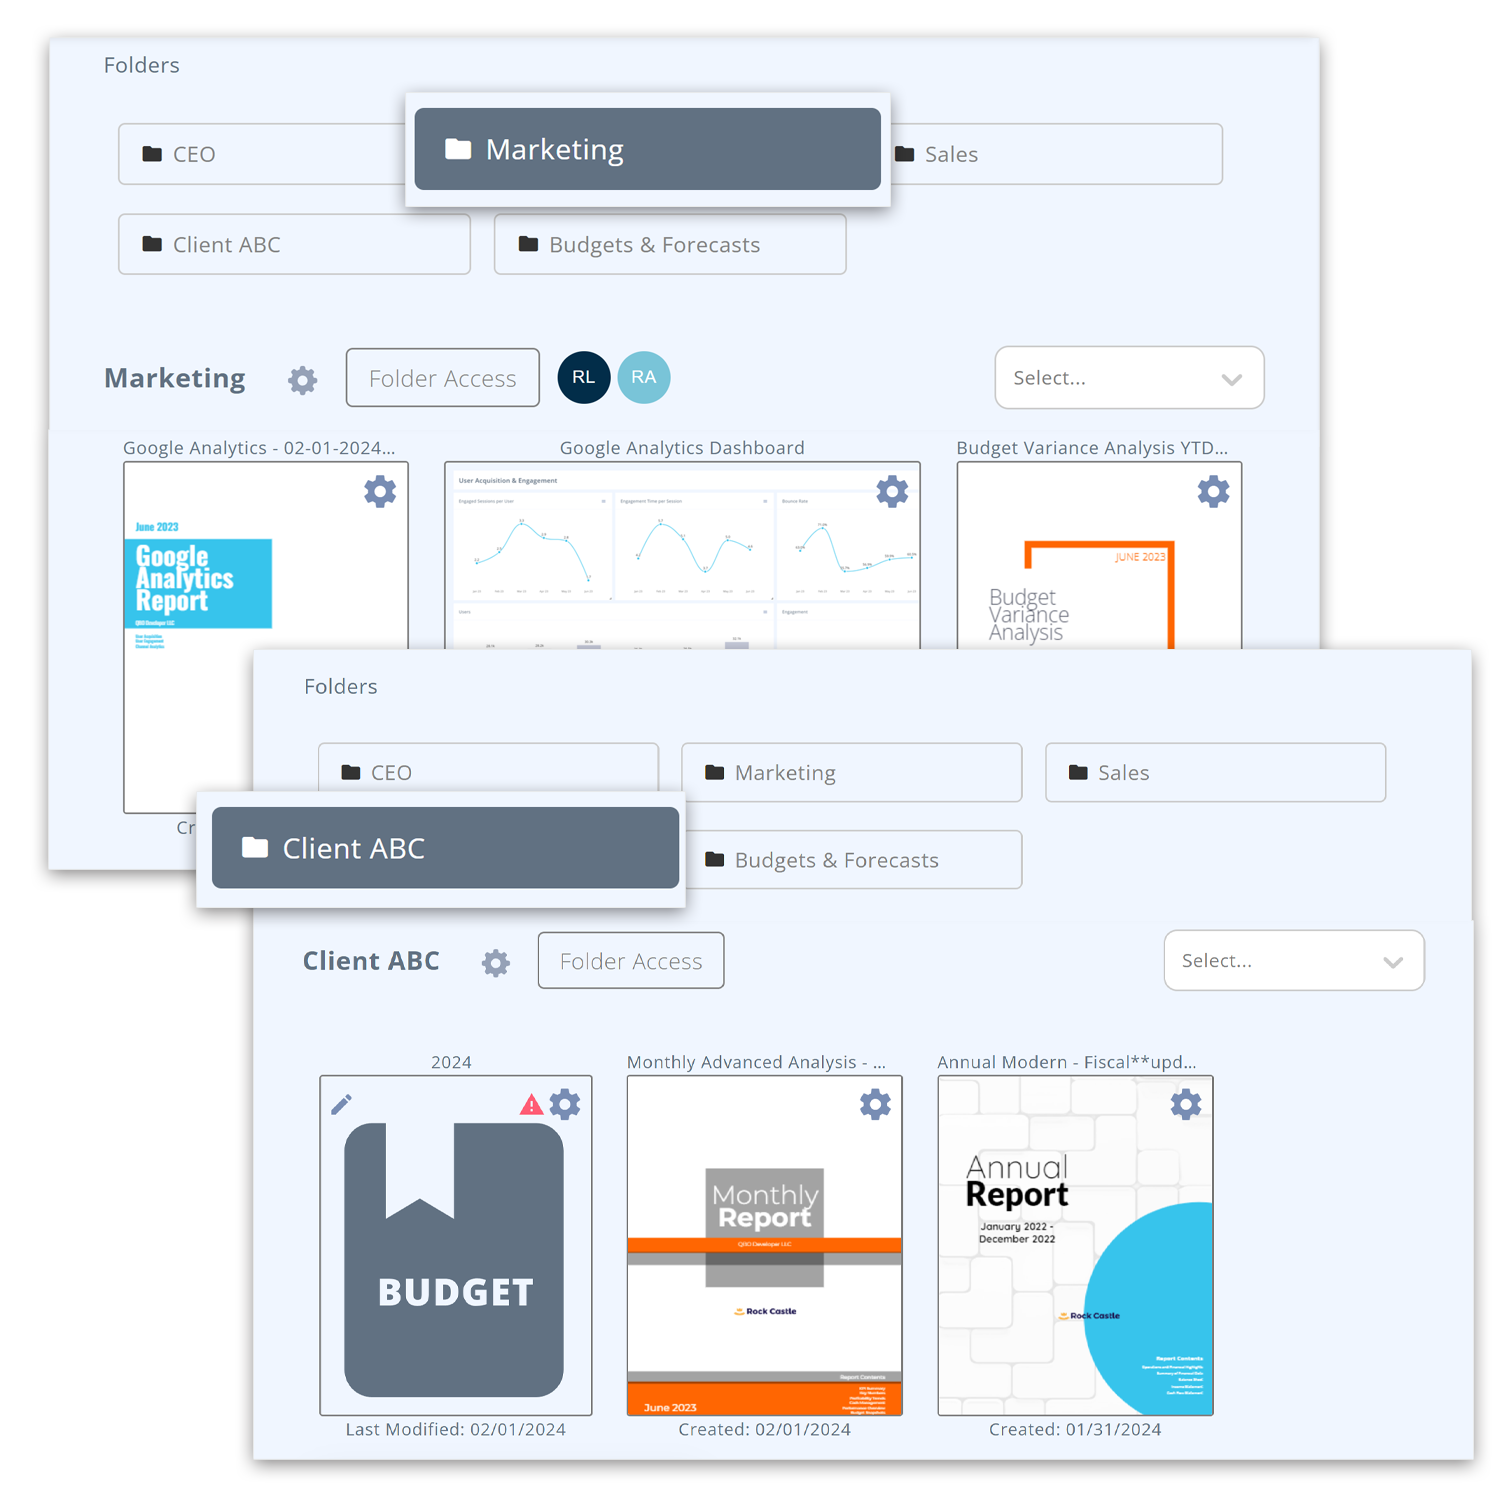
Empower
Your Team
AI Generated
Reports & Dashboards
Tired of spending hours building reports and dashboards? Our latest AI-powered features take financial reporting to the next level—automating data insights, generating reports in seconds, and creating stunning dashboards effortlessly.
Visual Metrics
Once set up, your reports and dashboards are dynamically updated as data flows in. Repetitive tasks are in the past.

Save hours transforming data.
How can Reach Reporting help your business?
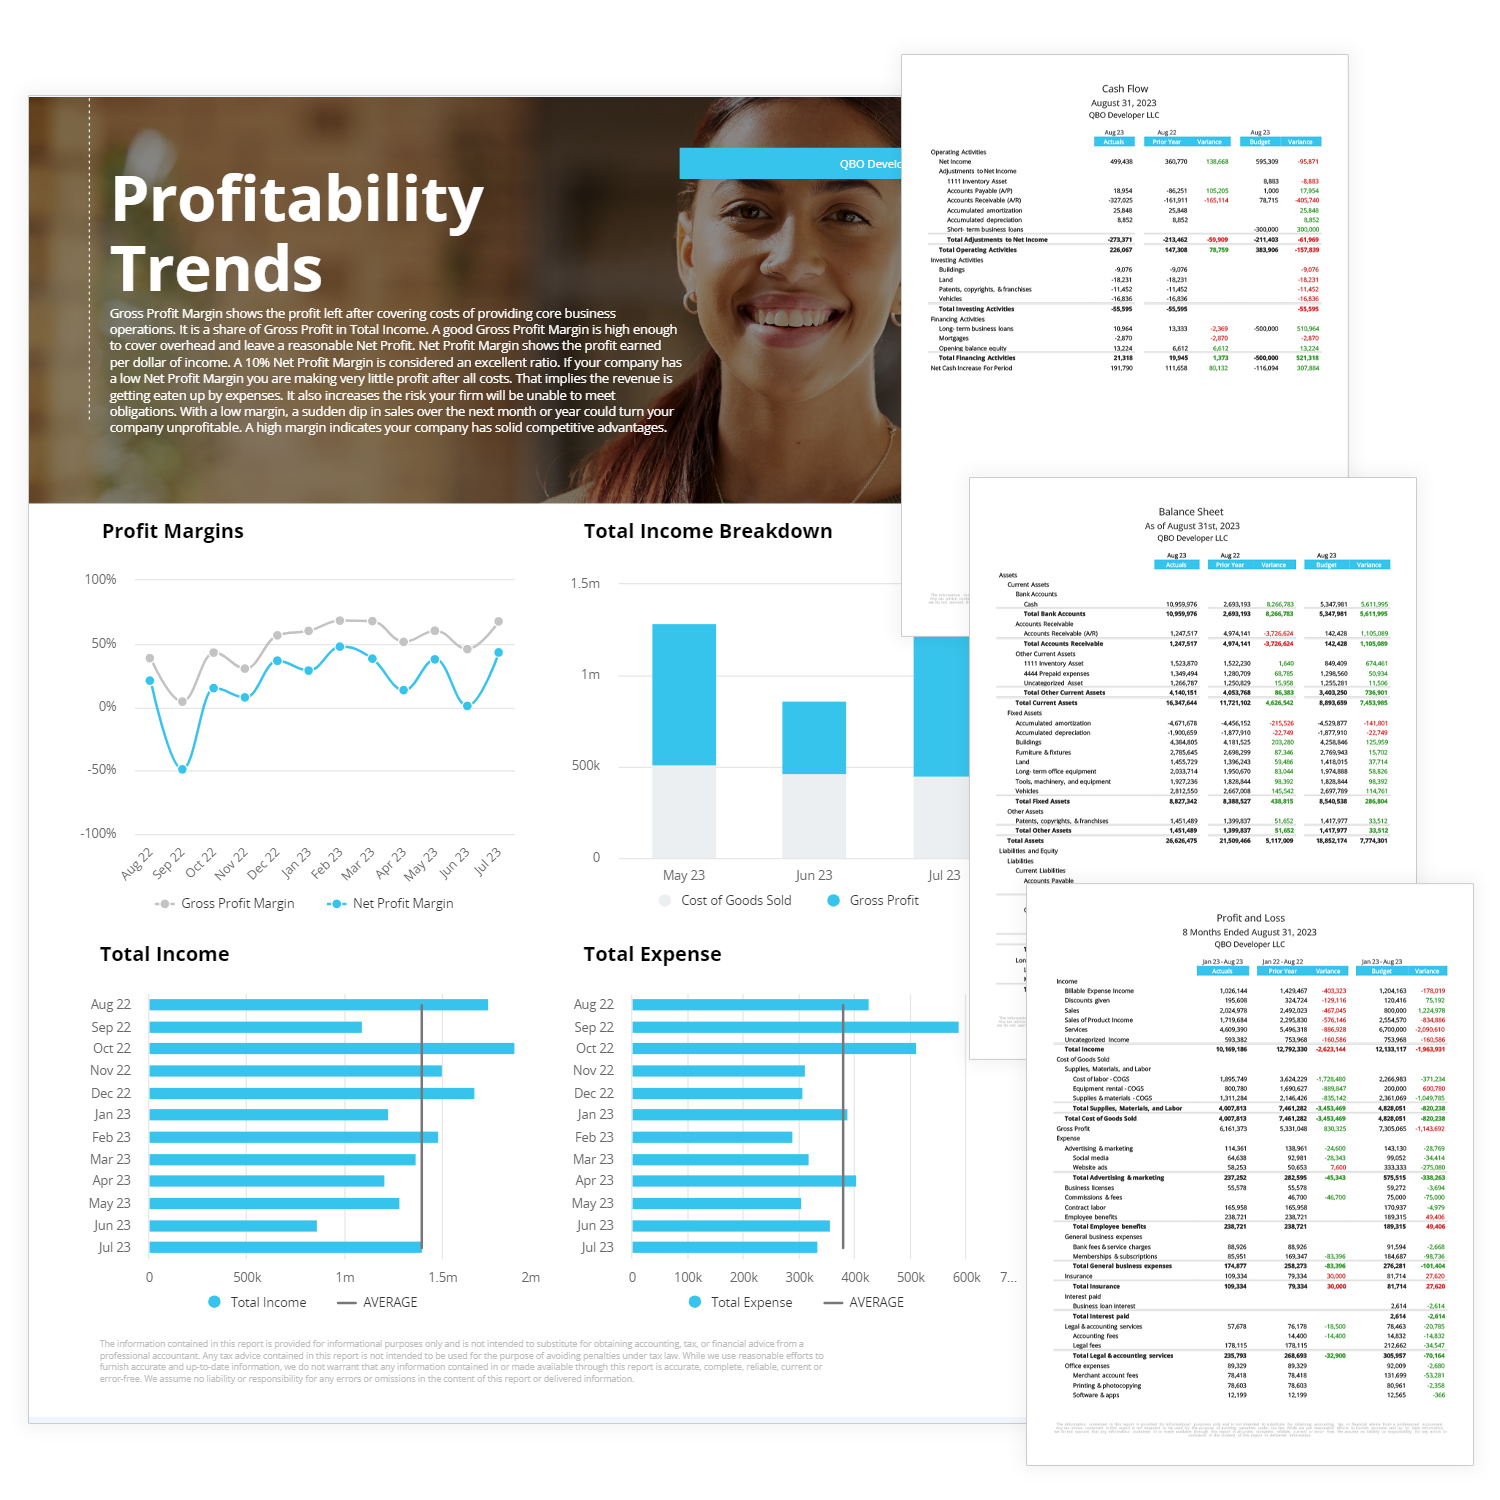
Automated
Monthly Close
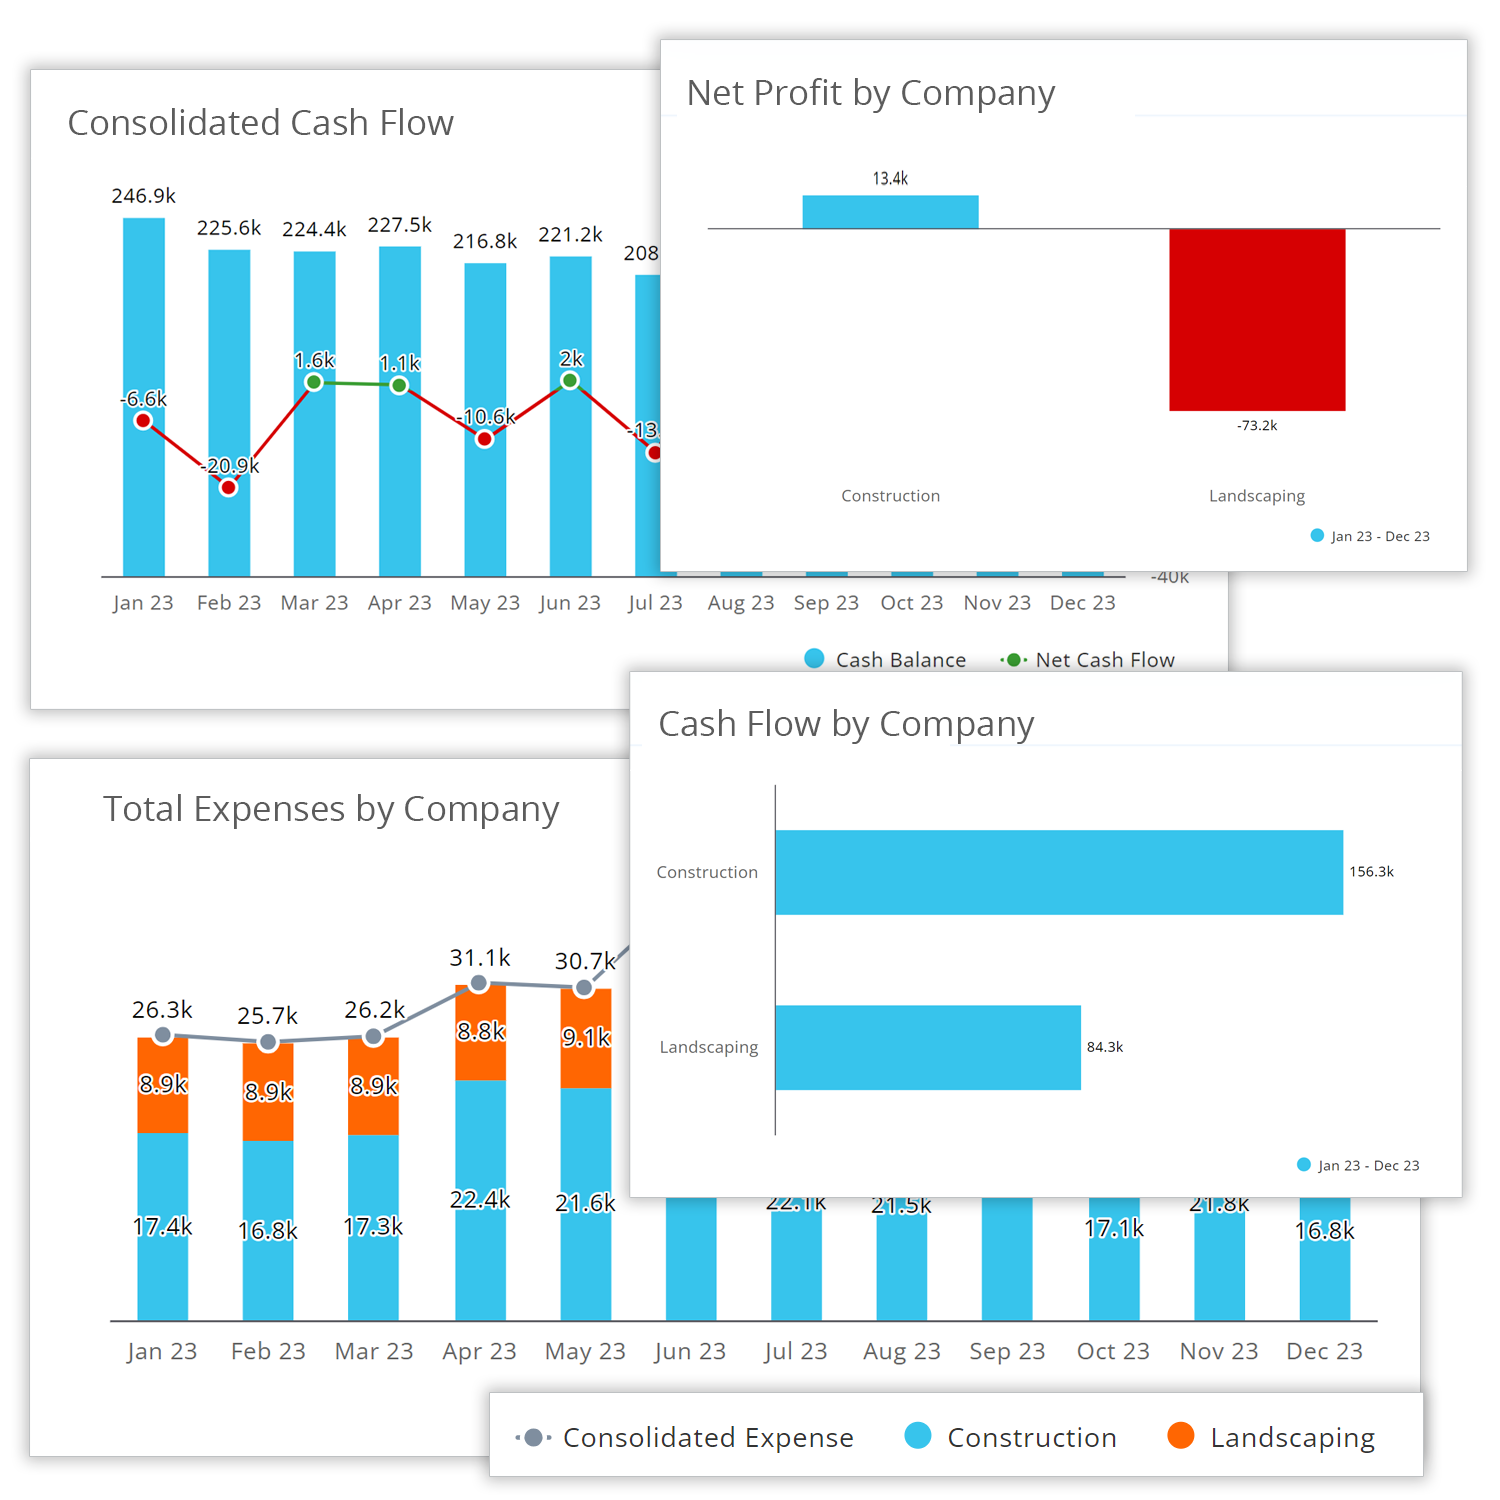
Automated
Consolidation
3-Way
Planning
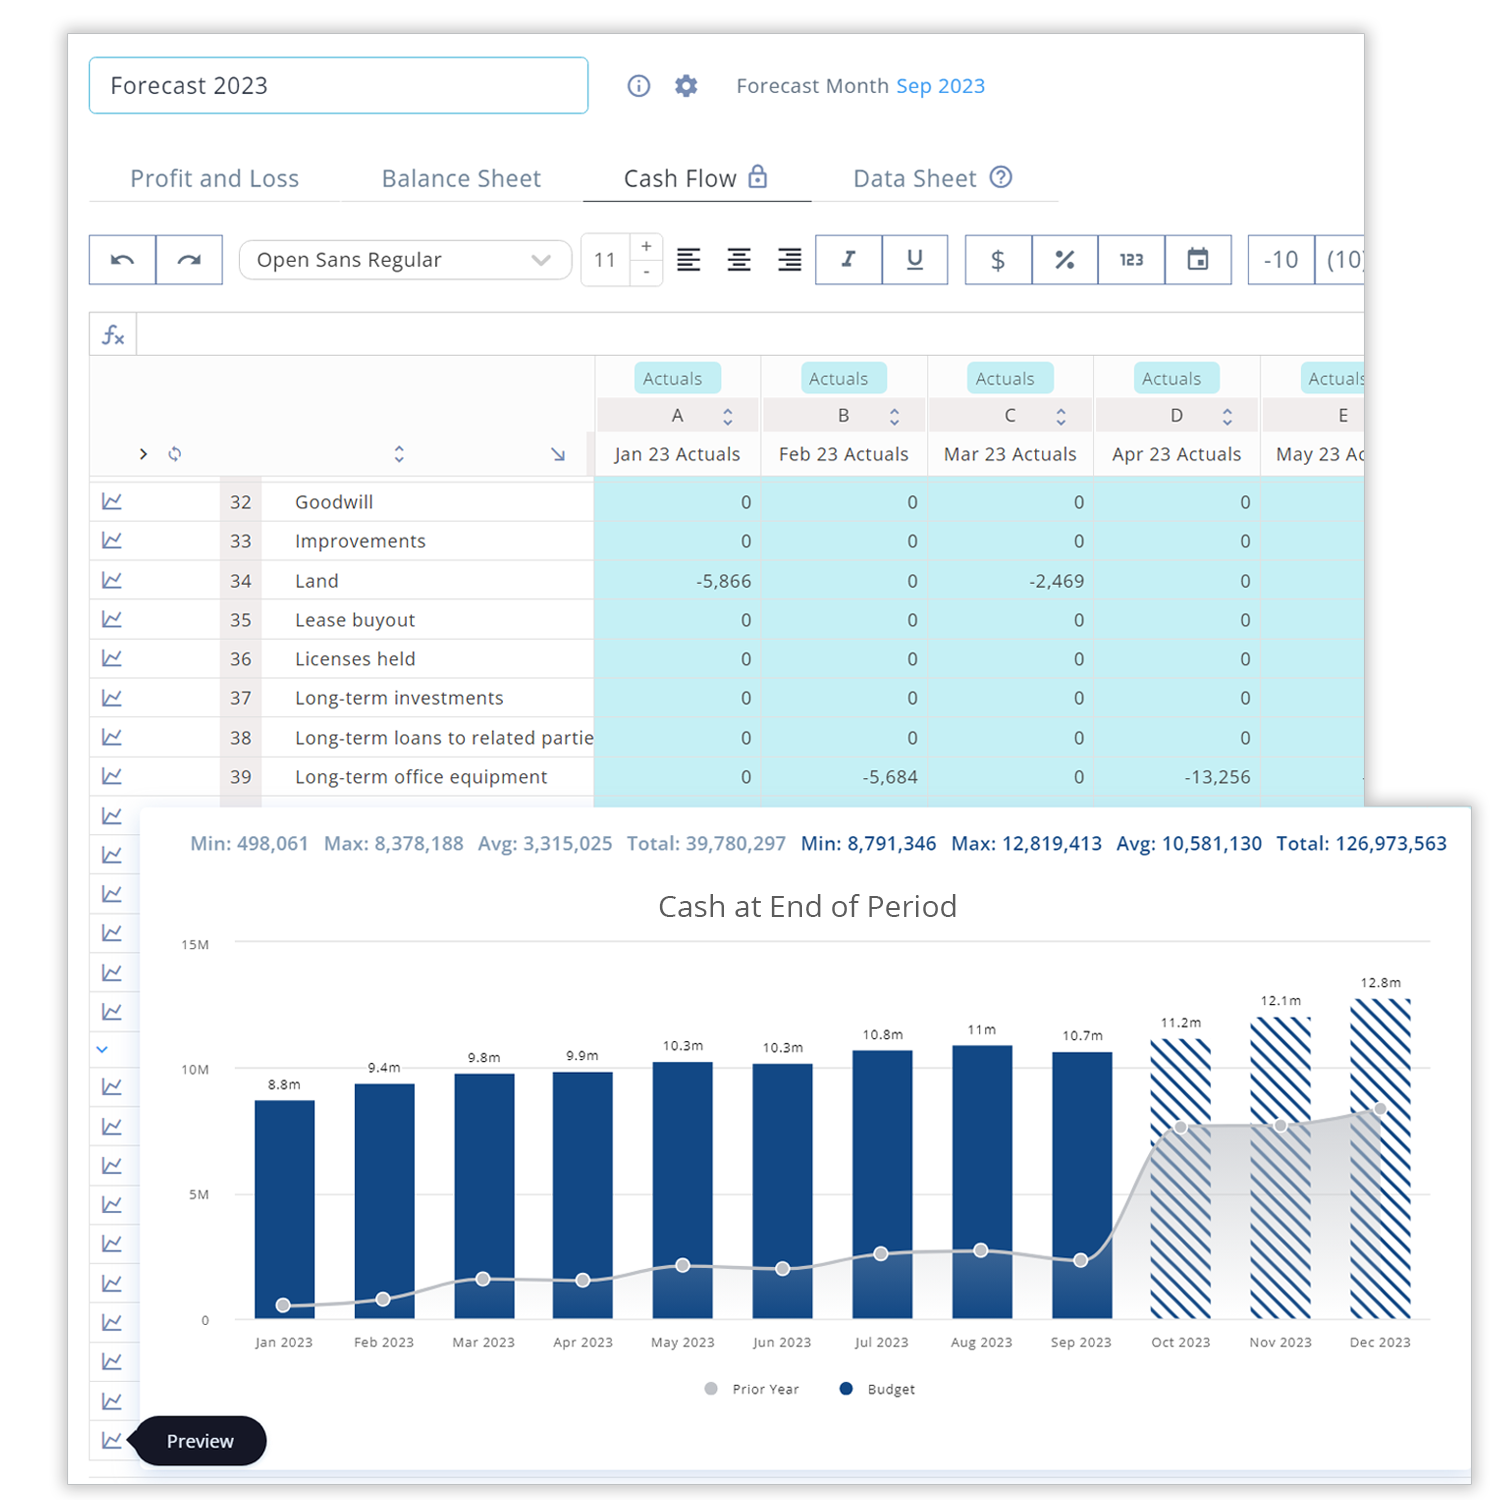
Our integrated 3-way forecasting provides a complete picture of projected business scenarios in minutes by seamlessly integrating the P&L, Balance Sheet, and Cash Flow Statement. Budget and forecast by department or class, and tweak drivers on your P&L to instantly visualize their impact on monthly cash flow and balance sheet positions.
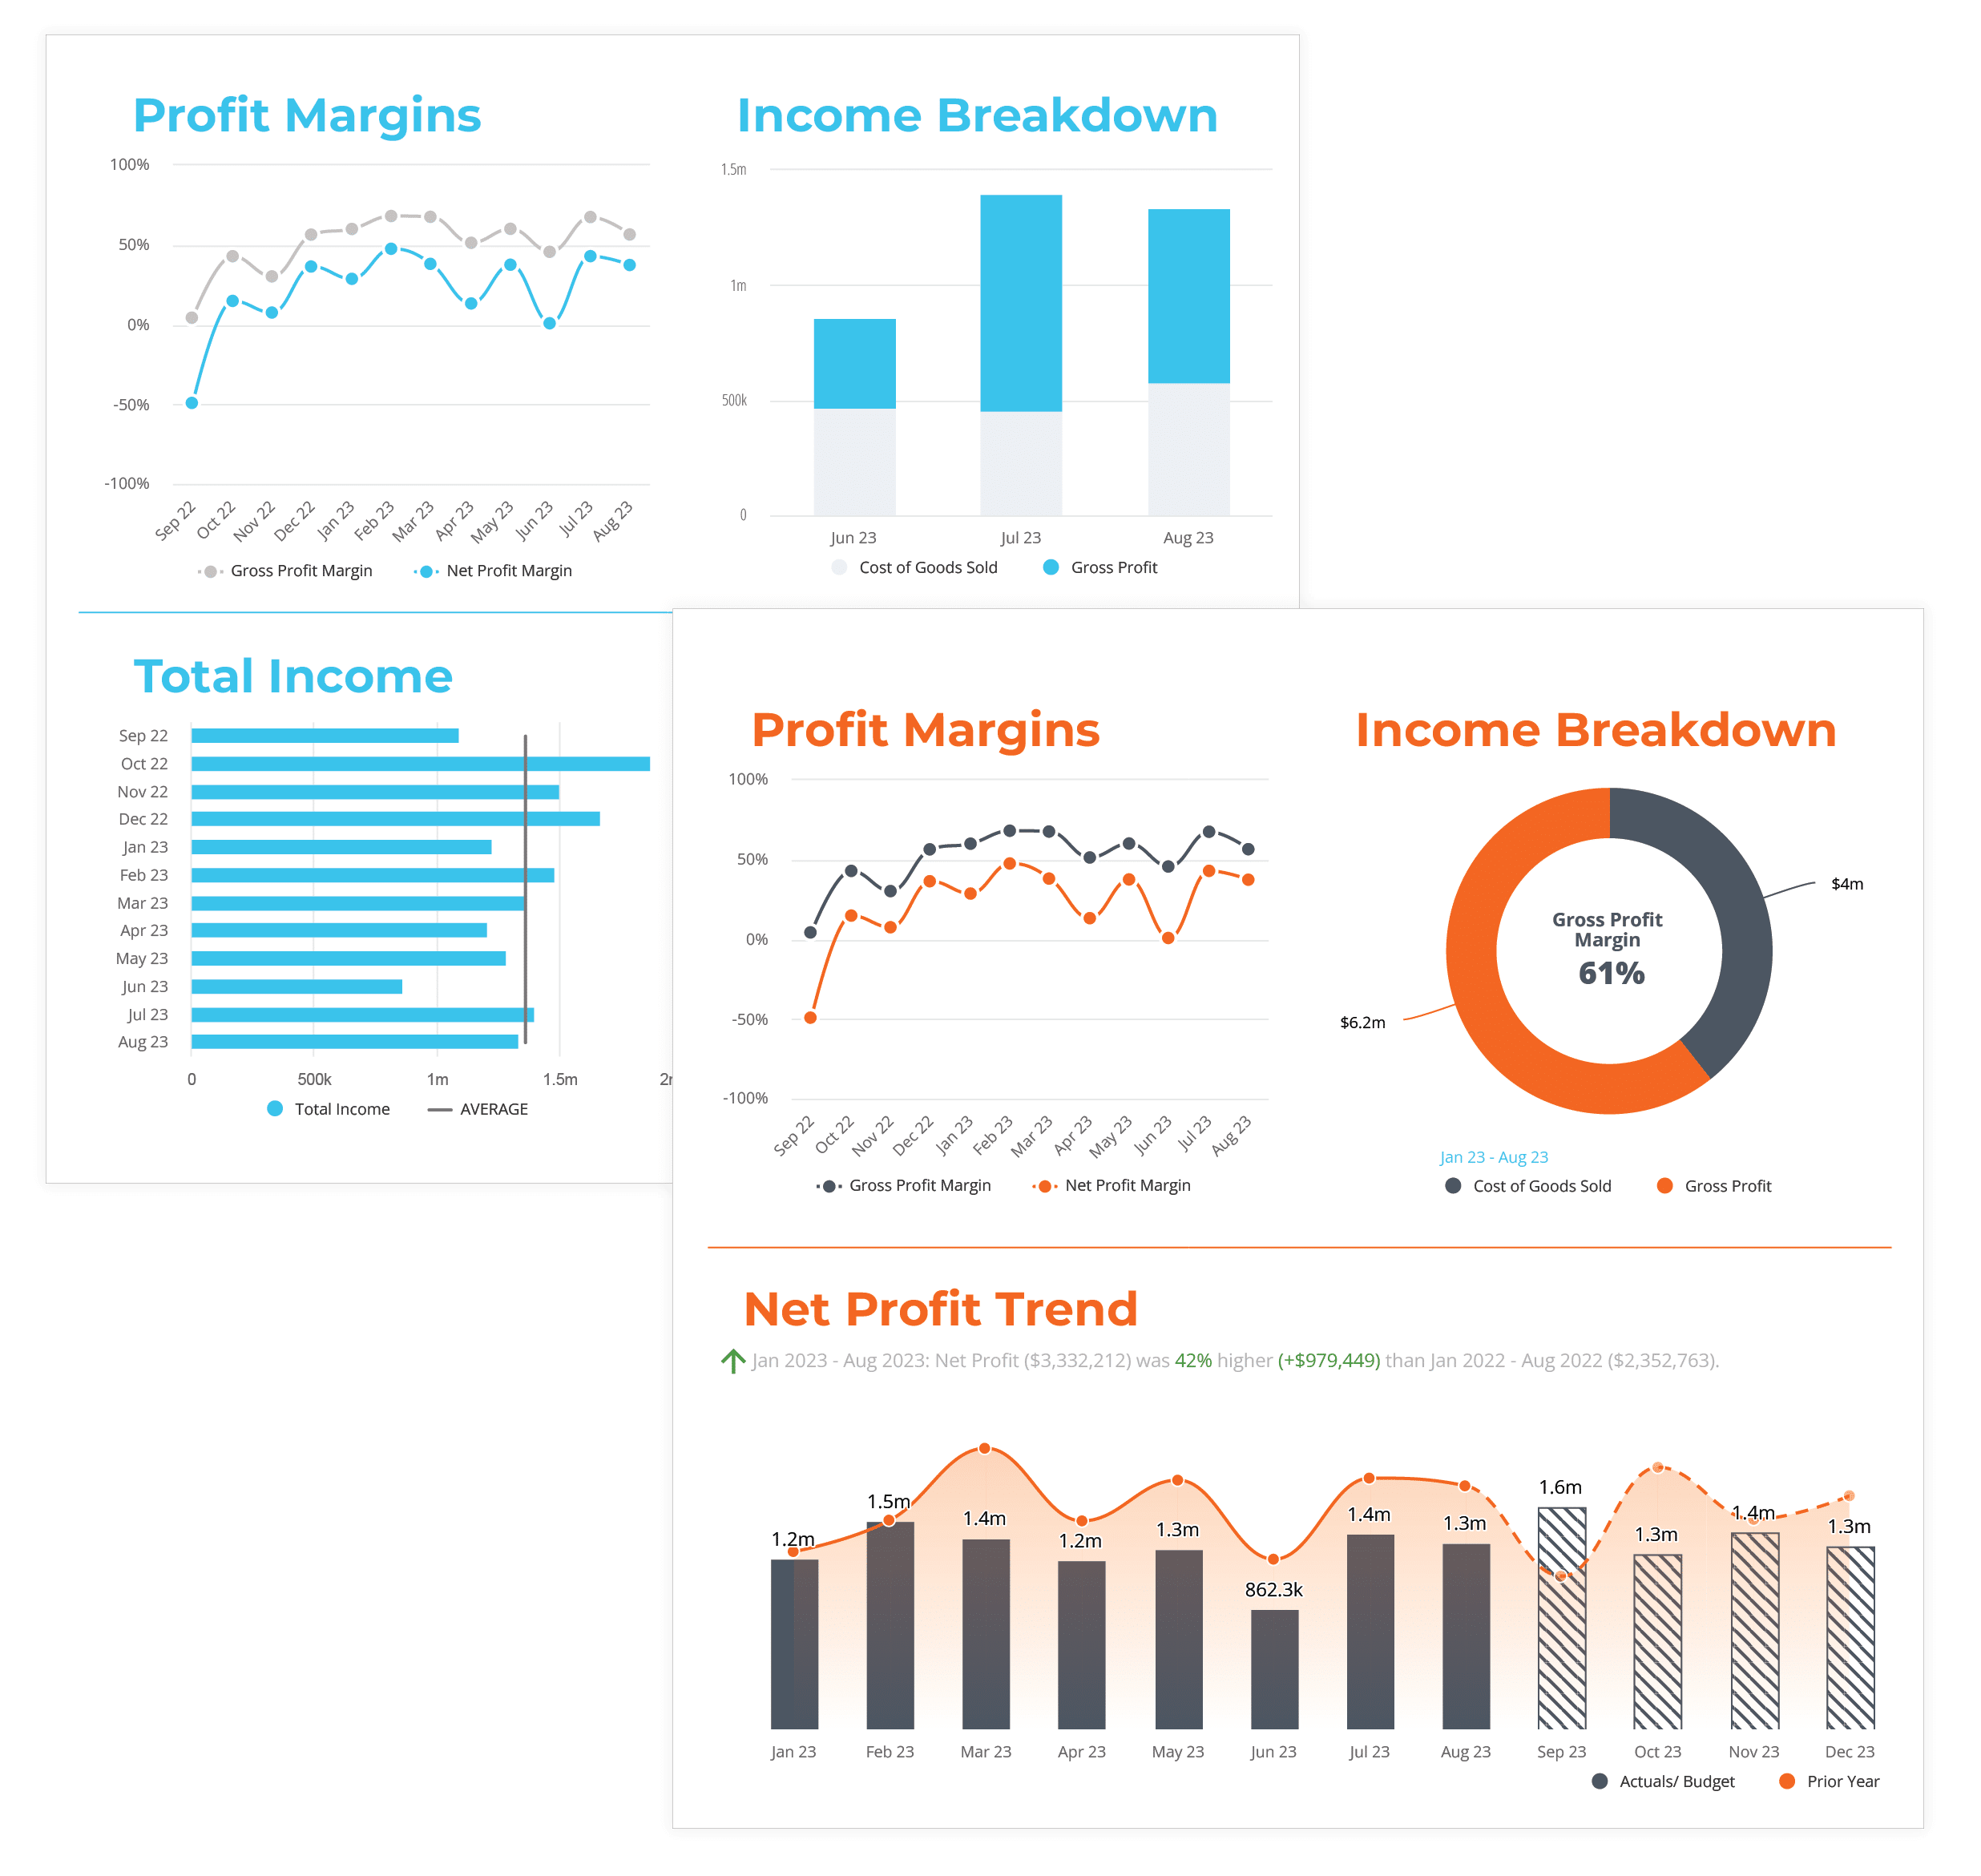
Provide
Analysis
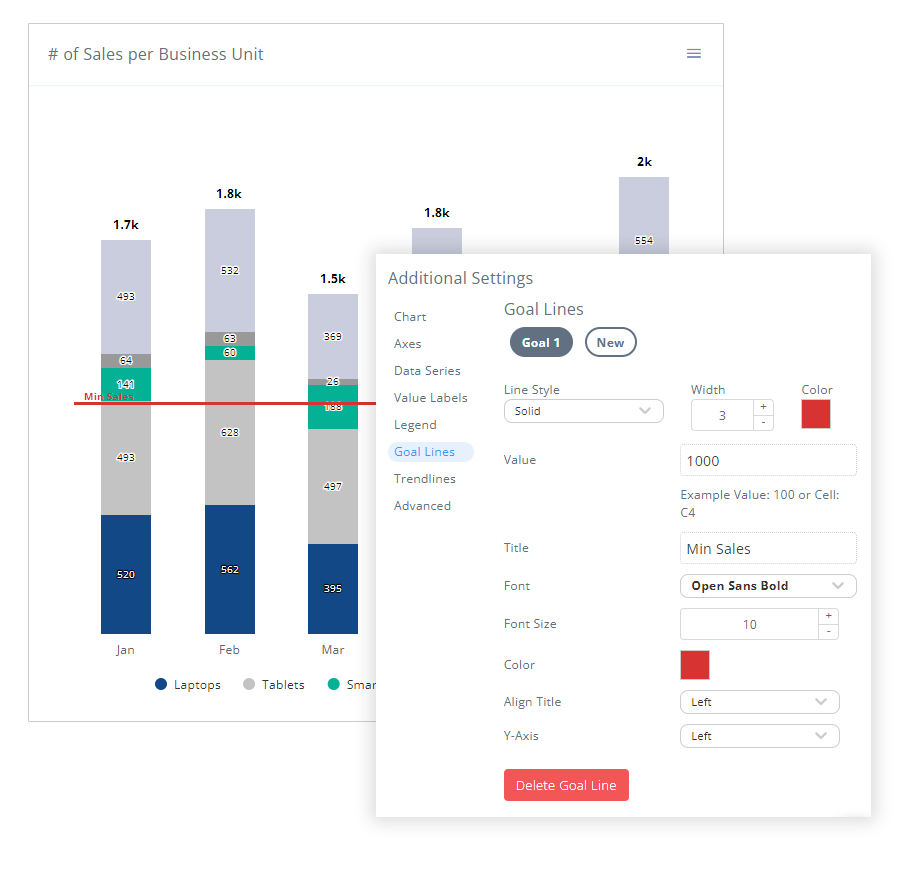
Non-Financial
Integration
See what


