Special Offer
Save 30% for the first three months on monthly plans or save 30% on annual plans. This offer is for all listeners of The Accounting Podcast. Start your free trial to lock in this pricing today!


Seamless
Connection
Access 3rd-party accounting software, Excel, and uploaded CSV data. Reach also provides the added advantage of Google Sheets. All data automatically populates any predefined template in your company library.

Predefined
Reports
Though Reach Reporting offers predefined reports, we understand predefined reports can restrict what you’re trying to say. That’s why we ensure you have the ability to completely change adjust, customize, or visually display any metric, anyway, and anywhere you want. If that’s not enough then we give you the ability to build anything from scratch.

Robust
Templates
Reach Reporting has a robust library of entirely customizable reports, metrics, and dashboard templates. Developed on visual theory, every report produced by Reach Reporting is built for maximum value to the reader and focuses on portraying difficult information—simply.

Powerful
Visualization
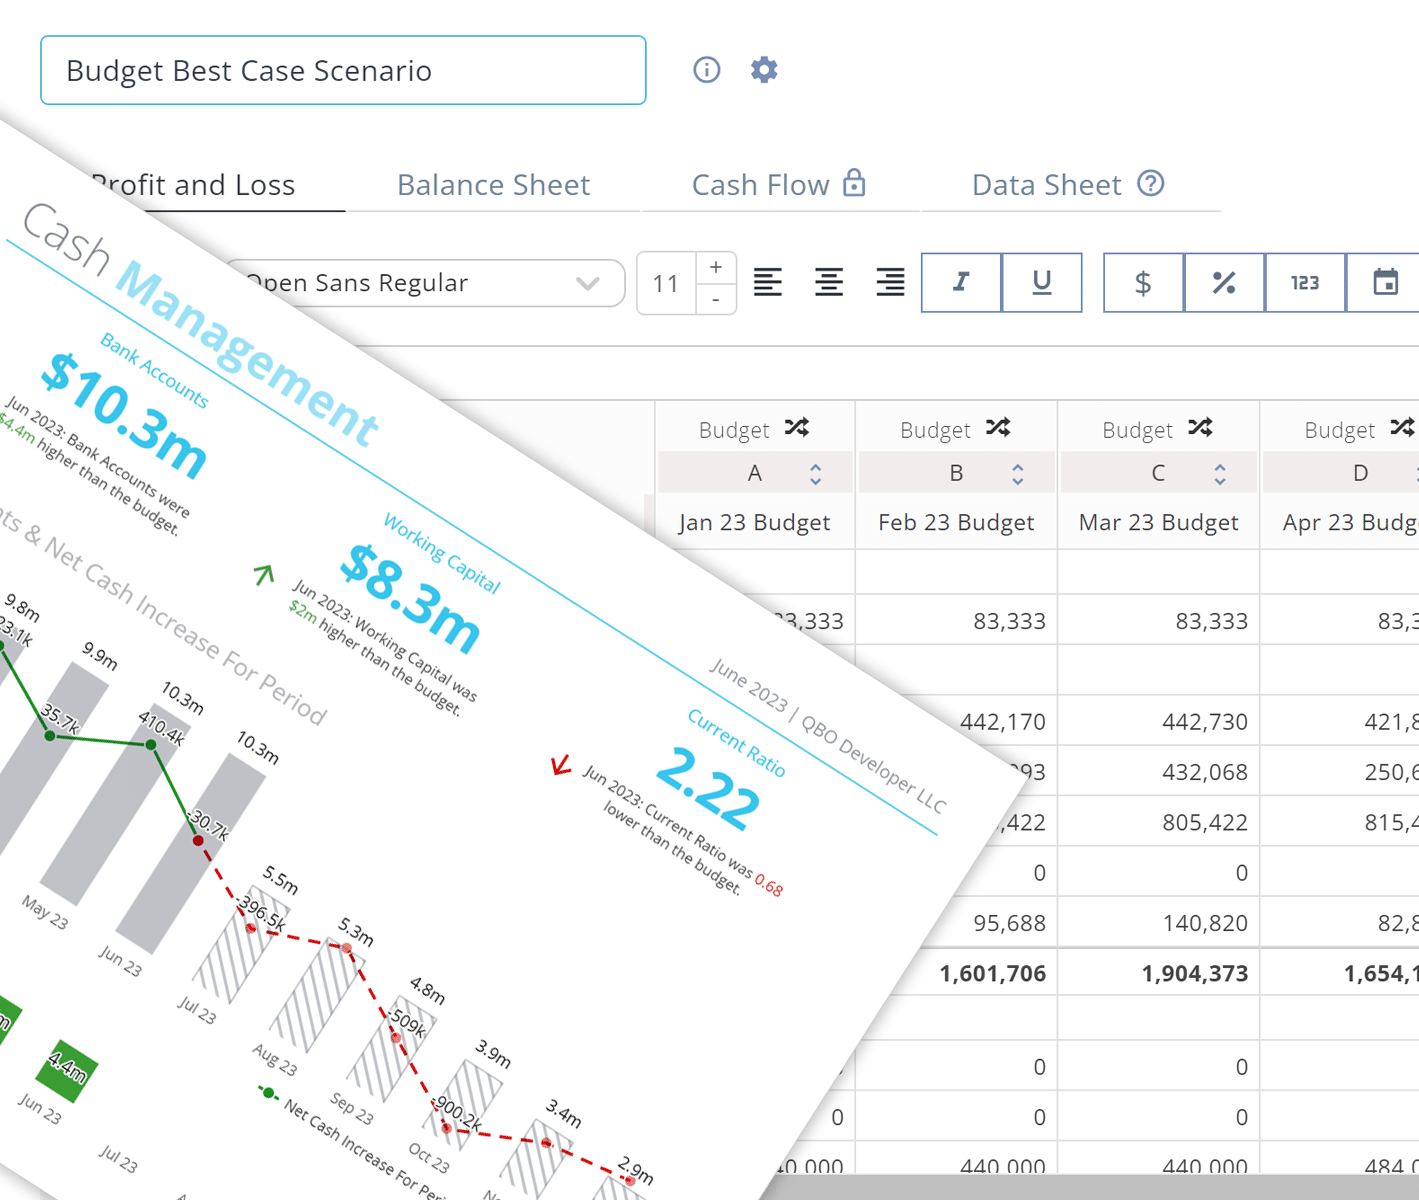
Reach Reporting gives you complete access to build reports exactly how you want visually. Instead of just moving a metric up and down on a page, Reach lets you place images, text blocks, visual metrics, statements, and more to create incredible reports. Use the spreadsheet workspace to do even more.

Built-in
Spreadsheet
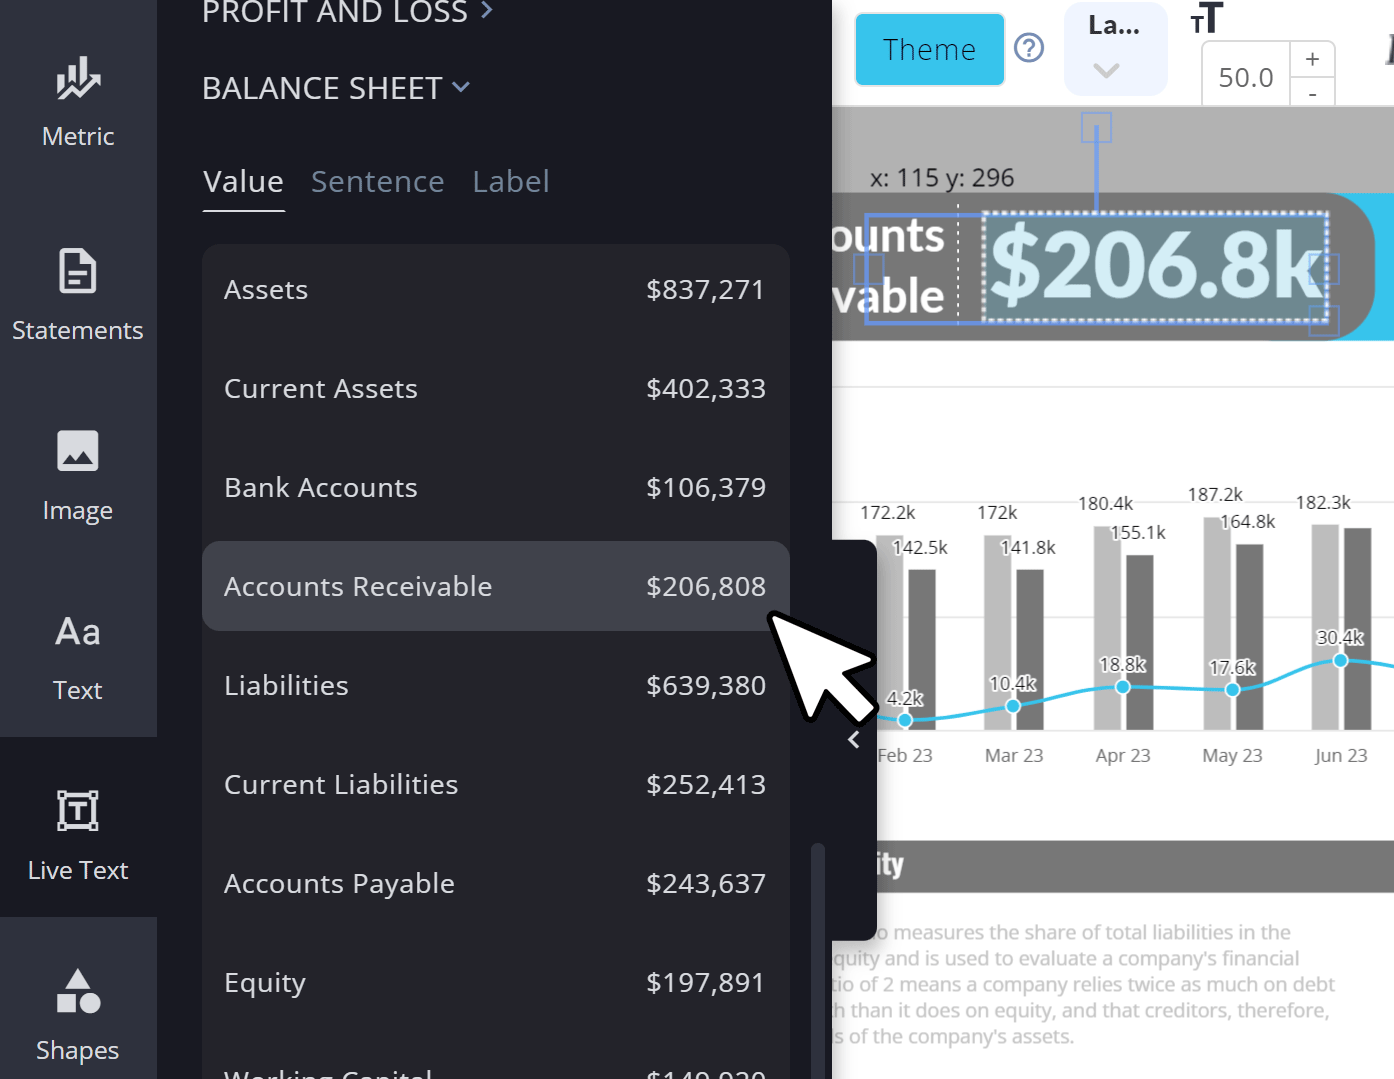
Reach enhances your ability to present influential reports by providing access to a built-in spreadsheet. Pull live data into any cell with just a click, use familiar formulas, work in a comfortable environment, and display your data any way you want. Build it once to be automatically tailored for any client again and again. Our competition doesn’t provide this flexibility.

User
Friendly
Reach’s simplicity is leading the market with an amazing workspace built into the report itself. There’s no need to keep switching workspaces to make changes, additions, or develop special reports.

Tailor Any
Report
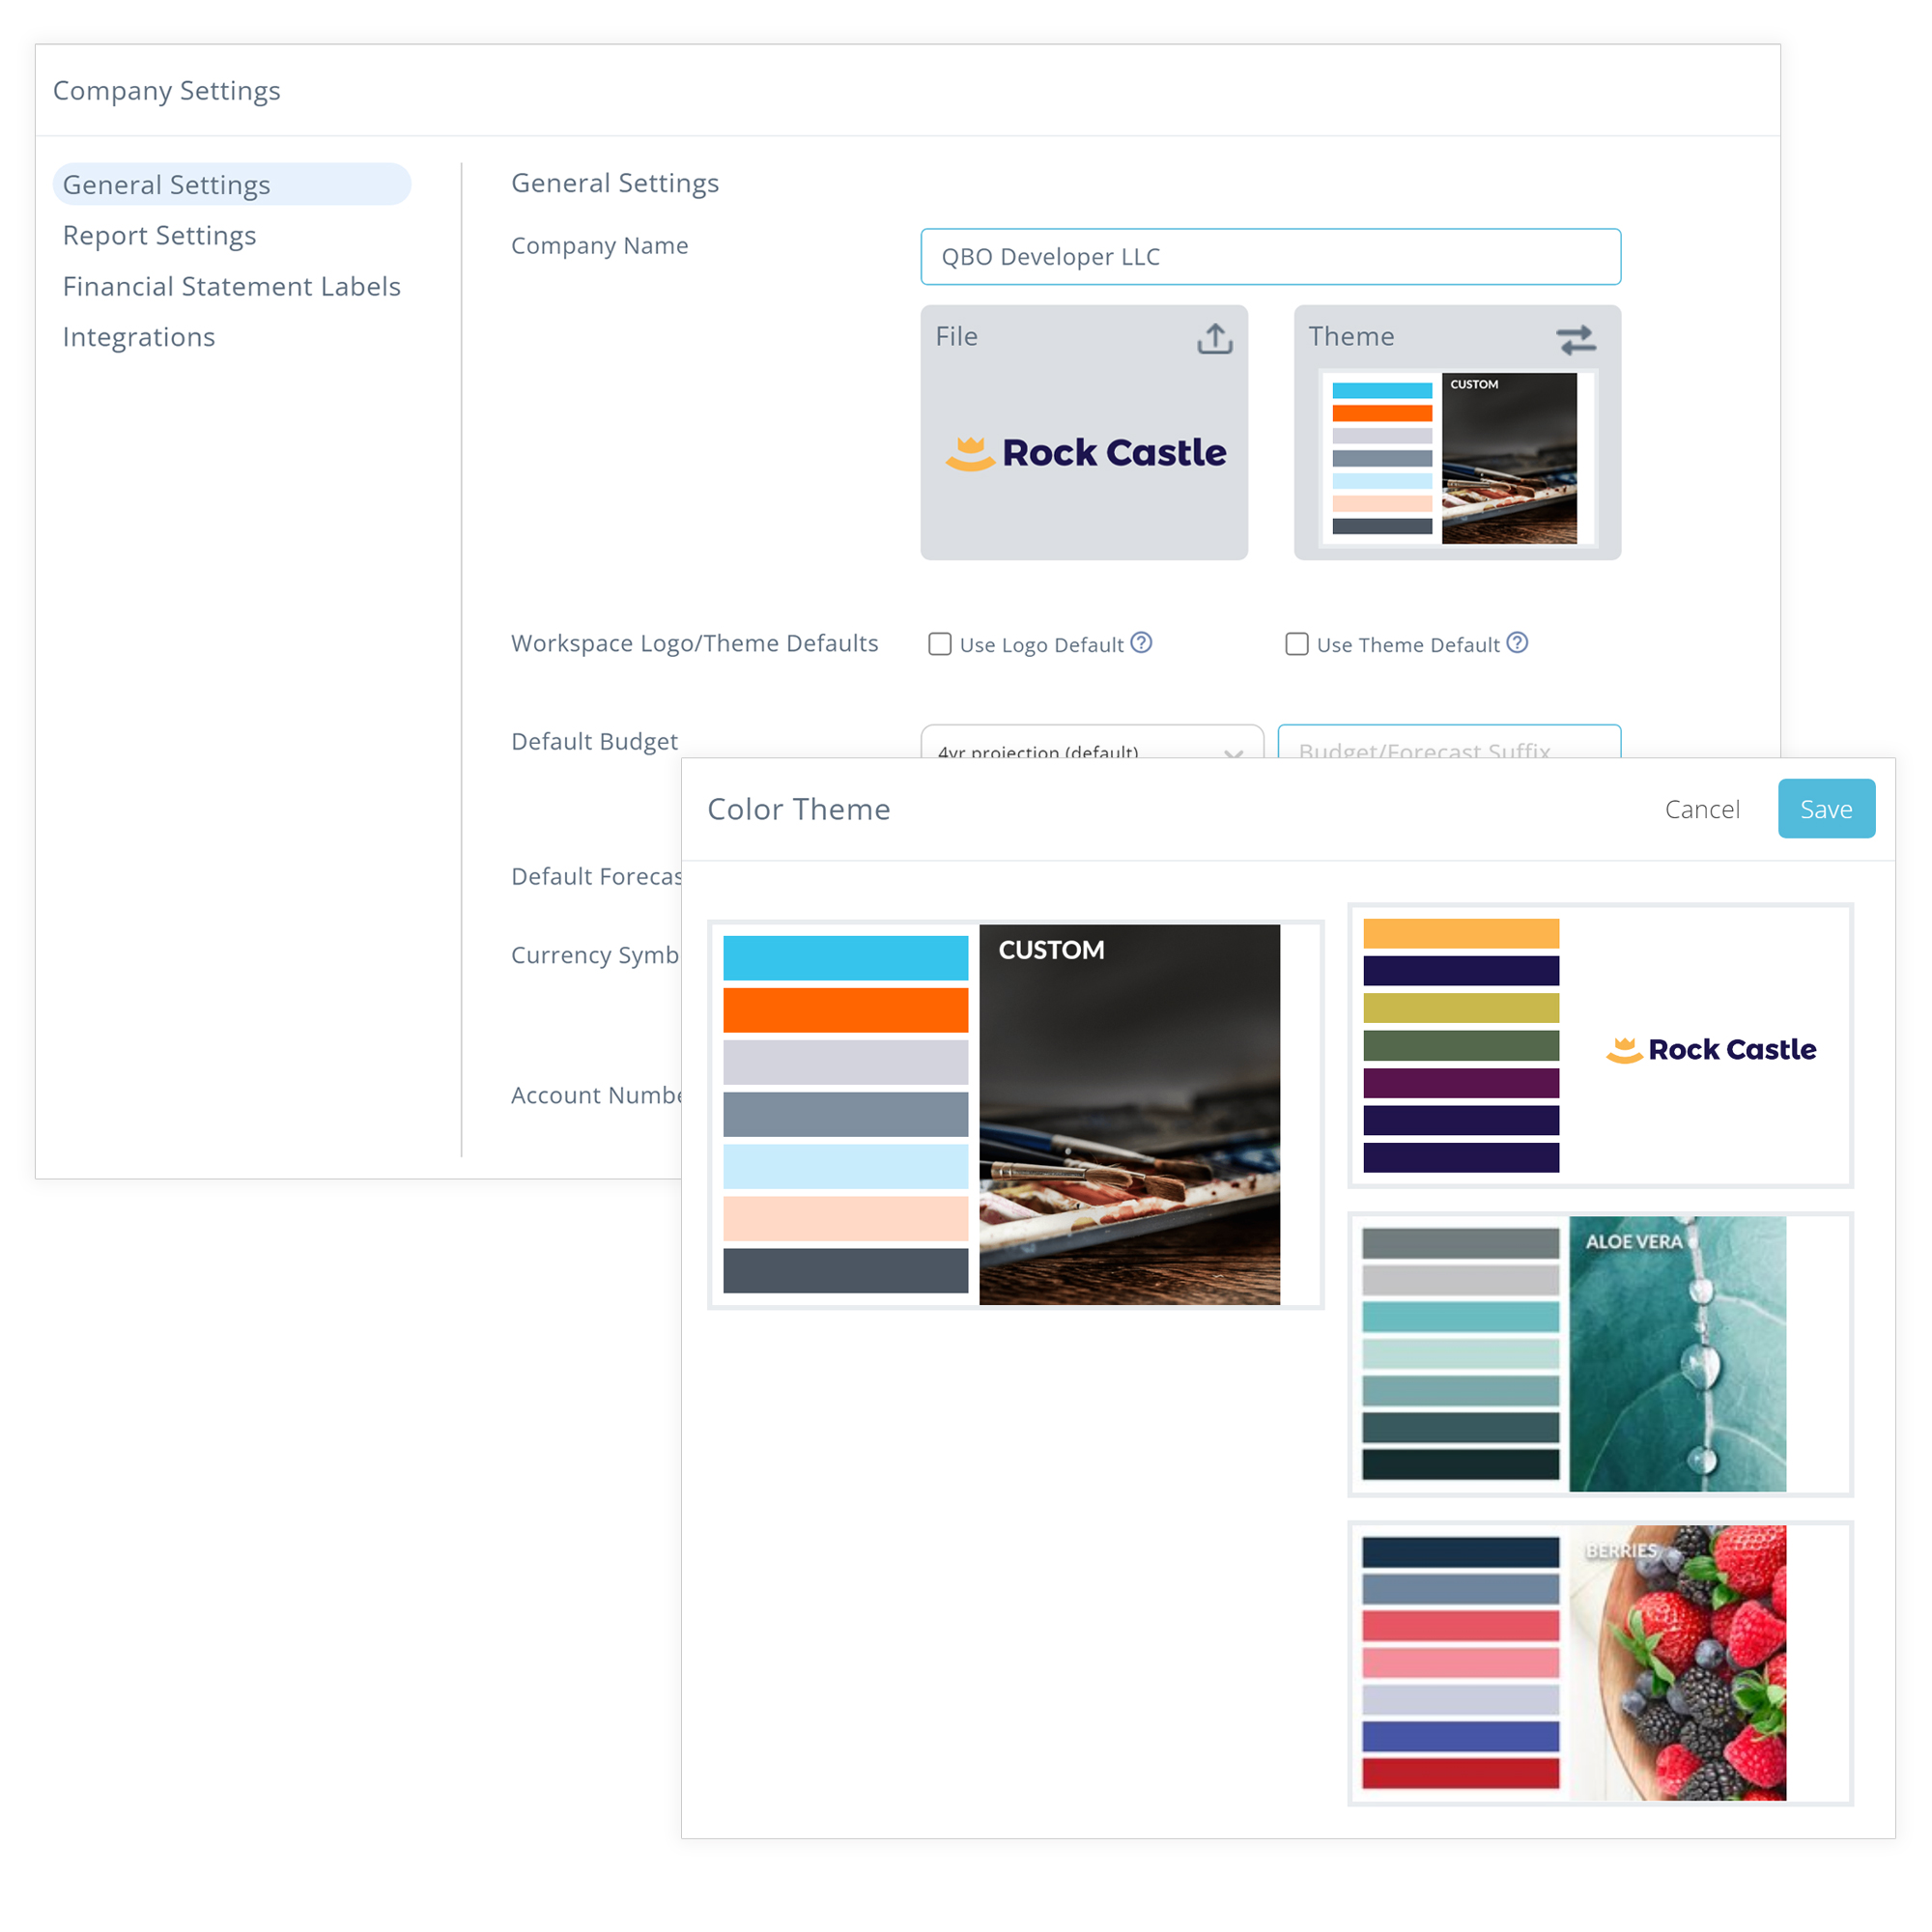
Rather than manually adjusting every report to reflect a client’s brand, Reach utilizes live logos, colors, and text to automatically customize and tailor every report to any company.

Access
Anywhere
Reach Reporting has a true-to-form dashboard that is mobile-friendly and interactive. Quickly allow your clients to change reporting periods, to compare, strategize, and gain insightful perspectives—no matter what device they are on.

Comprehensive
Training
With live training, online video tutorials, and chat, we make sure you are confident in producing reports that increase your value and help you continue to wow your clients.
