NEWS RELEASE FOR IMMEDIATE RELEASE Reach Reporting Integrates with Digits, Bringing AI-Native...
Reach Reporting Integrates with Digits
read more
In order to help you the best, tell us what kind of business would describe you?
NEWS RELEASE FOR IMMEDIATE RELEASE Reach Reporting Integrates with Digits, Bringing AI-Native...
Reach Reporting + Digits: Better Data. Better Advisory. By Justin Hatch, CEO + Co-Founder of Reach...
NEWS RELEASE FOR IMMEDIATE RELEASE Reach Reporting Wraps Successful Showing as Sponsor at RightNOW...
NEWS RELEASE FOR IMMEDIATE RELEASE Reach Reporting Wraps Successful Showing at Accountex London...
NEWS RELEASE FOR IMMEDIATE RELEASE Reach Reporting to Sponsor and Exhibit at RightNOW in San...
NEWS RELEASE FOR IMMEDIATE RELEASE Reach Reporting to Exhibit at Accountex London & The FD...
NEWS RELEASE FOR IMMEDIATE RELEASE Reach Reporting Wraps Successful Debut at Accounting &...
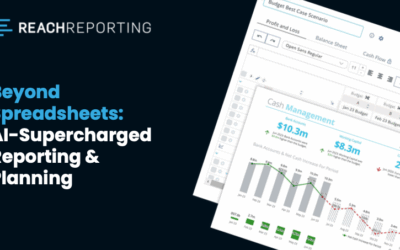
If you’re still spending hours each month cobbling together reports, you’re not alone — but you...
NEWS RELEASE FOR IMMEDIATE RELEASE Reach Reporting to Exhibit at Accounting & Business Expo in...
NEWS RELEASE FOR IMMEDIATE RELEASE Reach Reporting Joins Intuit App Partner Program as a Platinum...

If you’re still spending hours each month cobbling together reports, you’re not alone — but you...
Manual reporting is the most expensive task you don't track. It's invisible on your P&L but...

"We built a tool that let business owners see KPIs—but it wasn’t until accountants started using...
Intuit hosted a webinar with Arthur Boutin, Director of Sales at Reach Reporting, who shared a...

Signed into law on July 4, 2025, H.R. 1, the One Big Beautiful Bill Act, is a beast of a...

For decades, mortgage-lending institutions have operated within a well-defined, conservative...

Franchise Financial Reporting Series – Bonus Article Build Multi-Location Financial...

Franchise Financial Reporting Series – Bonus Article How to Create a Consolidated Franchise Report...

Franchise Financial Reporting Series – Part 6 of 6 Franchise owners need more than hindsight—they...

Franchise Financial Reporting Series – Part 5 of 6 Franchise owners don’t need more data — they...

Franchise Financial Reporting Series – Part 4 of 6 Franchise owners don’t need spreadsheets. They...

Franchise Financial Reporting Series – Part 3 of 6 Financial metrics mean nothing if franchise...

Franchise Financial Reporting Series – Part 2 of 6 Franchise owners aren't accountants — and they...

Franchise Financial Reporting Series – Overview Franchise businesses operate differently — so why...

Modeling COGS and Customer Impacts for Tariff-Driven Planning For businesses where Cost of...
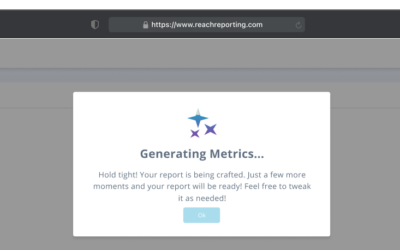
Introducing AI Financial Reporting: Your Virtual Financial Analyst Reach Reporting has been...

Financial reporting is crucial for franchise operations, enabling owners to monitor performance,...
Franchise owners, advisors, and CFOs face a complex landscape of financial oversight and...

Exciting news for businesses and advisors! Reach Reporting is now fully integrated with MYOB, a...

Building an Effective Tech Stack for MSPs: Streamlining Operations with Modern Solutions In the...
More articles
NEWS RELEASE FOR IMMEDIATE RELEASE Reach Reporting Integrates with Digits, Bringing AI-Native Ledger Data into Client-Ready Reporting and Budgeting Springville, Utah, United States — June 16, 2026 — Reach Reporting, the leading provider of financial reporting and...
Reach Reporting + Digits: Better Data. Better Advisory. By Justin Hatch, CEO + Co-Founder of Reach Reporting Accounting firms are expected to do more than deliver financial statements. They are expected to help clients understand what the numbers mean, identify...
NEWS RELEASE FOR IMMEDIATE RELEASE Reach Reporting Wraps Successful Showing as Sponsor at RightNOW 2026 in San Antonio Springville, Utah, United States — May 26, 2026 — Reach Reporting, the leading provider of financial reporting and budgeting services, wrapped up a...
NEWS RELEASE FOR IMMEDIATE RELEASE Reach Reporting Wraps Successful Showing at Accountex London & The FD Show Springville, Utah, United States — May 16, 2026 — Reach Reporting, the leading provider of financial reporting and budgeting services, wrapped up a...
Knowledge Center