Complex data simple reporting.

Show the Value.

Automated Reporting. Complete Customization.

SCHEDULE MY DEMO

ACCESS DATA FROM DIFFERENT SOURCES

Connection

Access 3rd-party accounting software, Excel, and uploaded CSV data. Reach also provides the added advantage of Google Sheets. All data automatically populates any predefined template in your company library.

REPORTS, METRICS, STATEMENTS, & DASHBOARDS

Templates

Reach Reporting has a robust library of entirely customizable reports, metrics, and dashboard templates. Developed on visual theory, every report produced by Reach Reporting is built for maximum value to the reader and focuses on portraying difficult information—simply.

LOOKS GOOD. SCHEDULE MY DEMO.
REMOVE THE CONSTRAINTS

Predefined

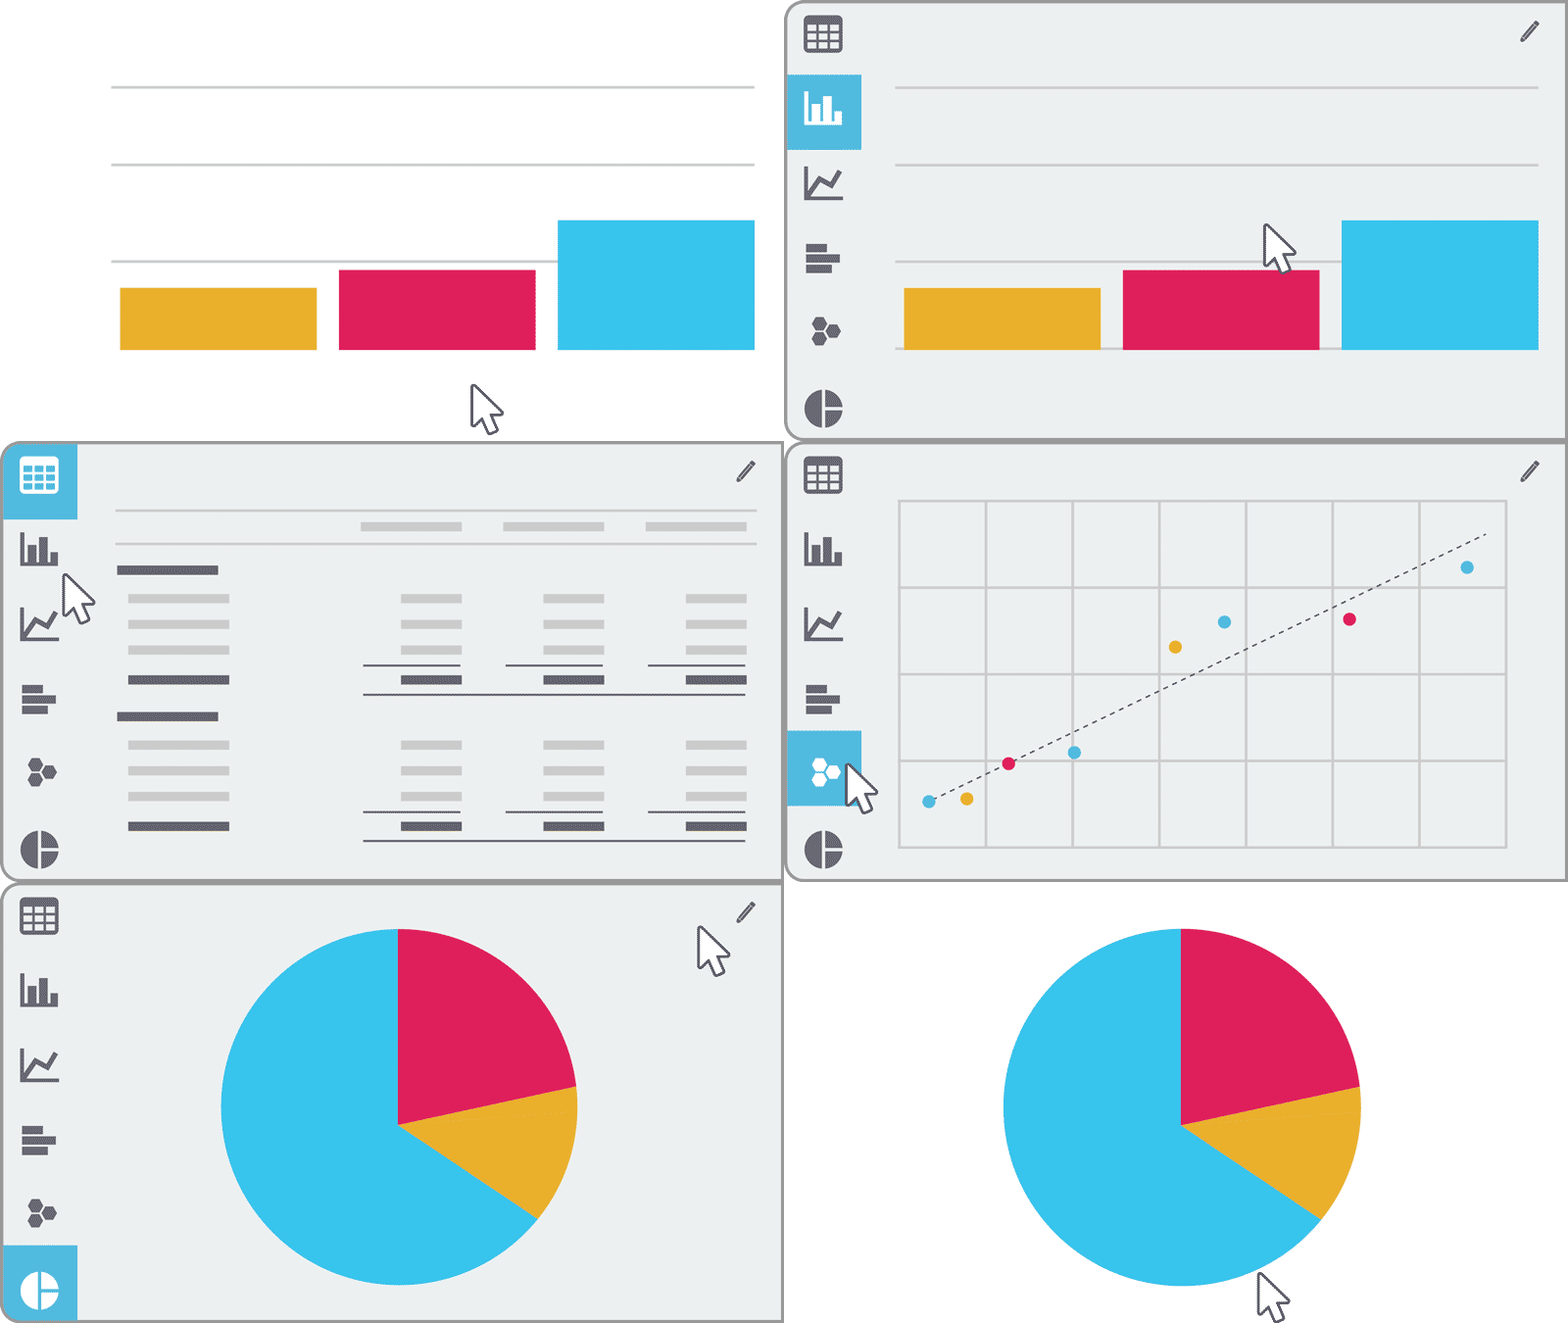
Though Reach Reporting offers predefined reports, we understand predefined reports can restrict what you’re trying to say. That’s why we ensure you have the ability to completely change adjust, customize, or visually display any metric, anyway, and anywhere you want. If that’s not enough then we give you the ability to build anything from scratch.

RIGHT MESSAGE, PERFECTLY TIMED.

Visualization

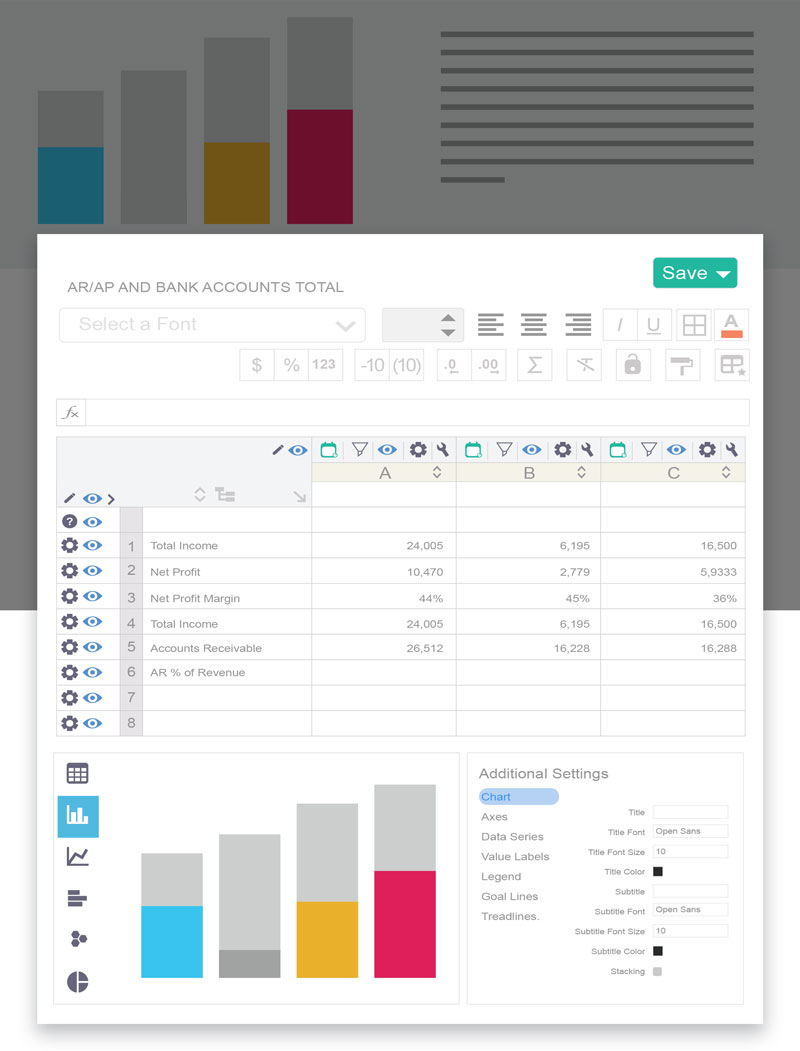
Reach Reporting gives you complete access to build reports exactly how you want visually. Instead of just moving a metric up and down on a page, Reach lets you place images, text blocks, visual metrics, statements, and more to create incredible reports. Use the spreadsheet workspace to do even more.

SERIOUSLY, I WANT A DEMO.
WORK FREELY—WITH ALL YOUR DATA

Spreadsheets

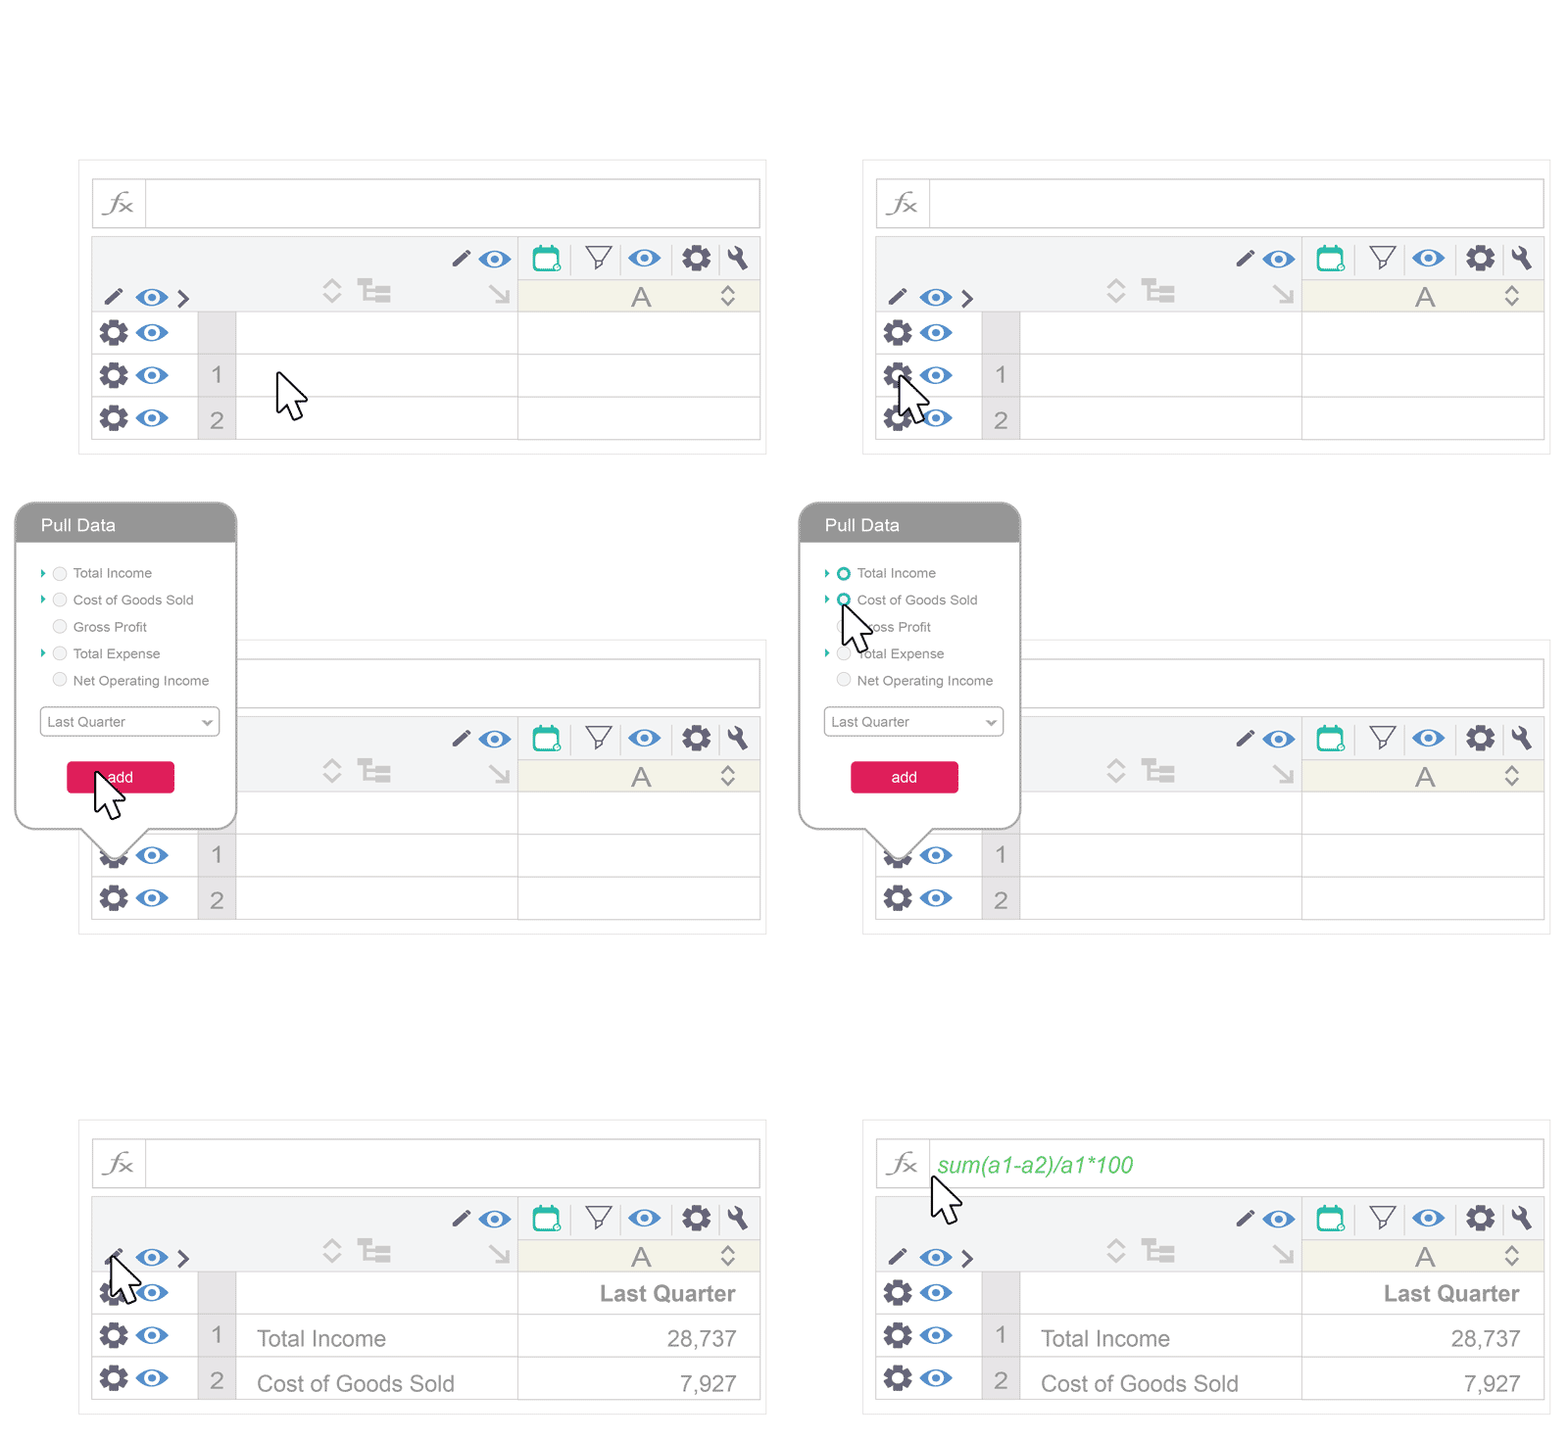
Reach enhances your ability to present influential reports by providing access to a built-in spreadsheet. Pull live data into any cell with just a click, use familiar formulas, work in a comfortable environment, and display your data any way you want. Build it once to be automatically tailored for any client again and again. Our competition doesn’t provide this flexibility. 

INCREASE YOUR VALUE WITHOUT INCREASING TIME

Tailored

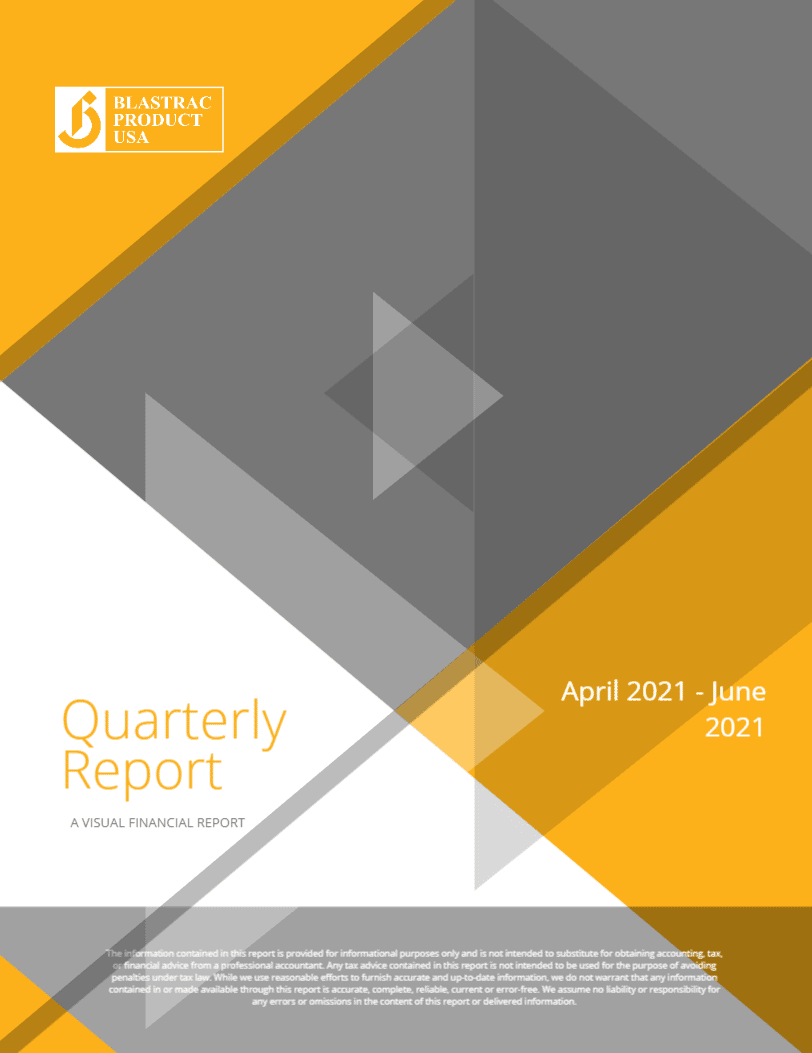
Rather than manually adjusting every report to reflect a client’s brand, Reach utilizes live: logos, colors, and text to automatically customize and tailor every report to any company.

OK! GIVE ME A DEMO.
A CONSISTENT WORKSPACE MAKES IT EASY

Simplicity

Reach’s simplicity is leading the market with an amazing workspace built into the report itself. There’s no need to keep switching workspaces to make changes, additions, or develop special reports.

SHOW THE VALUE. WHEREVER. HOWEVER.

Accessible

Reach Reporting has a true-to-form dashboard that is mobile-friendly and interactive. Quickly allow your clients to change reporting periods, to compare, strategize, and gain insightful perspectives—no matter what device they are on.

KNOWLEDGE IS POWER

Training

With live training, online video tutorials, and chat, we make sure you are confident in producing reports that increase your value and help you continue to wow your clients.

STRATEGIC INVESTMENT

Pricing

Our compitition may appear cheaper, but no solution offers the flexibility, automation, usability, or customizability of Reach. Saving you right away and in the long run. More importantly, making you more money as customer churn decreases and revenue increases.
Special Pricing

Lock in these prices. Start a free trial today.

MONTHLY

ANNUAL

1 Connection

$1,548

Annually 

SAVE $240

No Credit Card Required

10 Connections

$2,436

Annually 

SAVE $1,044

No Credit Card Required

25 Connections

$4,620

Annually 

SAVE $1,980

No Credit Card Required

1 Connection

$1,548

Annually 

SAVE $240

No Credit Card Required

10 Connections

$2,436

Annually 

SAVE $1,044

No Credit Card Required

25 Connections

$4,620

Annually 

SAVE $1,980

No Credit Card Required

1 Connection

$149

Monthly

Add Connection $149

No Credit Card Required

10 Connections

$290

Monthly

Add Connection $29

No Credit Card Required

25 Connections

$550

Monthly

Add Connection $22

No Credit Card Required

1 Connection

$149

Monthly

Add Connection $149

No Credit Card Required

10 Connections

$290

Monthly

Add Connection $29

No Credit Card Required

25 Connections

$550

Monthly

Add Connection $22

No Credit Card Required

SMARTER REPORTS – BETTER DECISIONS – STRONGER BUSINESS

Accountants are Talking.

Financial professionals love us. You will too!

Super Easy

"Reach was SUPER easy to set up and the graphs and charts are really easy to understand and tweak."

Amazing

"Reach reporting is amazing and so easy to work with."

Simple

"I really like that this app makes it simple and easy to create really nice looking dashboards that I can share with my teammates."

Helps Summarize

"This could be a great way to help them summarize the financial activities of the business in a simple and easy to use format."

Helps Summarize

"Helps us see trends on monthly financial reports which give context to monthly values and make them actionable."

Nice Looking

"I really like that this app makes it simple and easy to create really nice looking dashboards that I can share with my teammates."

Easy to Understand

"Reach was SUPER easy to set up and the graphs and charts are really easy to understand and tweak."

Value Immediately

"We logged in the first time and found several pre-built reports, dashboards and KPI's with OUR NUMBERS in them. It was really​ cool to see the value immediately."

See Information

"Reach Reporting has helped us organize our reporting. Now executives only see the information they want; information that is impactful."

Easy to Read Charts

"Reach Reporting has given me a simple way to communicate with my team complex financial information distilled down into easy to read charts."

Templates are Fantastic

"Love the ability to create templates of metrics and reports that you and your team can use across the platform."

Incredibly Powerful

"It's basically what would happen if Tableau and Excel had a baby. They somehow were able to pack every feature you could want, Made it incredibly powerful, and still make it a pleasure to use. "

Intuitive

"The customization is very easy to use, intuitive and very much designed to think like Excel but, of course, without the potential for human interface errors, constant updating."

The Best Tool

"This tool is HANDS DOWN the best tool that I have ever used to produce financials, trends, and KPIs. I have been looking for this tool my ENTIRE career."

Blown Away

"I was blown away! I love how customize-able it is because as a Non-profit, all our lingo is different, even when using the Non-profit version of QB."