Bringing Data Together
All your Financial Data at Your Fingertips
Stop Manual Entry
Automatically pull data from anywhere
Reach your live data no matter where it is located and work with it seamlessly to create powerful metrics, spreadsheets, dashboards, and reports in minutes.

SCROLL TO LEARN MORE

Data You Can Work With
Pull data into any cell to create meaningful formulas
Take any piece of data from your multiple disparate financial systems and let them work together with other data to create a new perspective quicker. Spreadsheets that took you hours previously to build, now take moments.
SCROLL TO LEARN MORE
Don’t Rebuild Every Month
Turn any spreadsheet, metric, dashboard, or report into a template.
Save time by choosing from our growing library of popular spreadsheets, metrics, dashboards, or reports to use and customize. You can also build from scratch creating your own template for your specific reporting needs.
SCROLL TO LEARN MORE

Share Data Instantly
Give your client intuitive dashboards and visual reports.
Take any piece of data from your multiple disparate financial systems and integrate with your other data to create a new perspective of information quicker. Spreadsheets that took you hours previously to build, now take moments.
SCROLL TO LEARN MORE
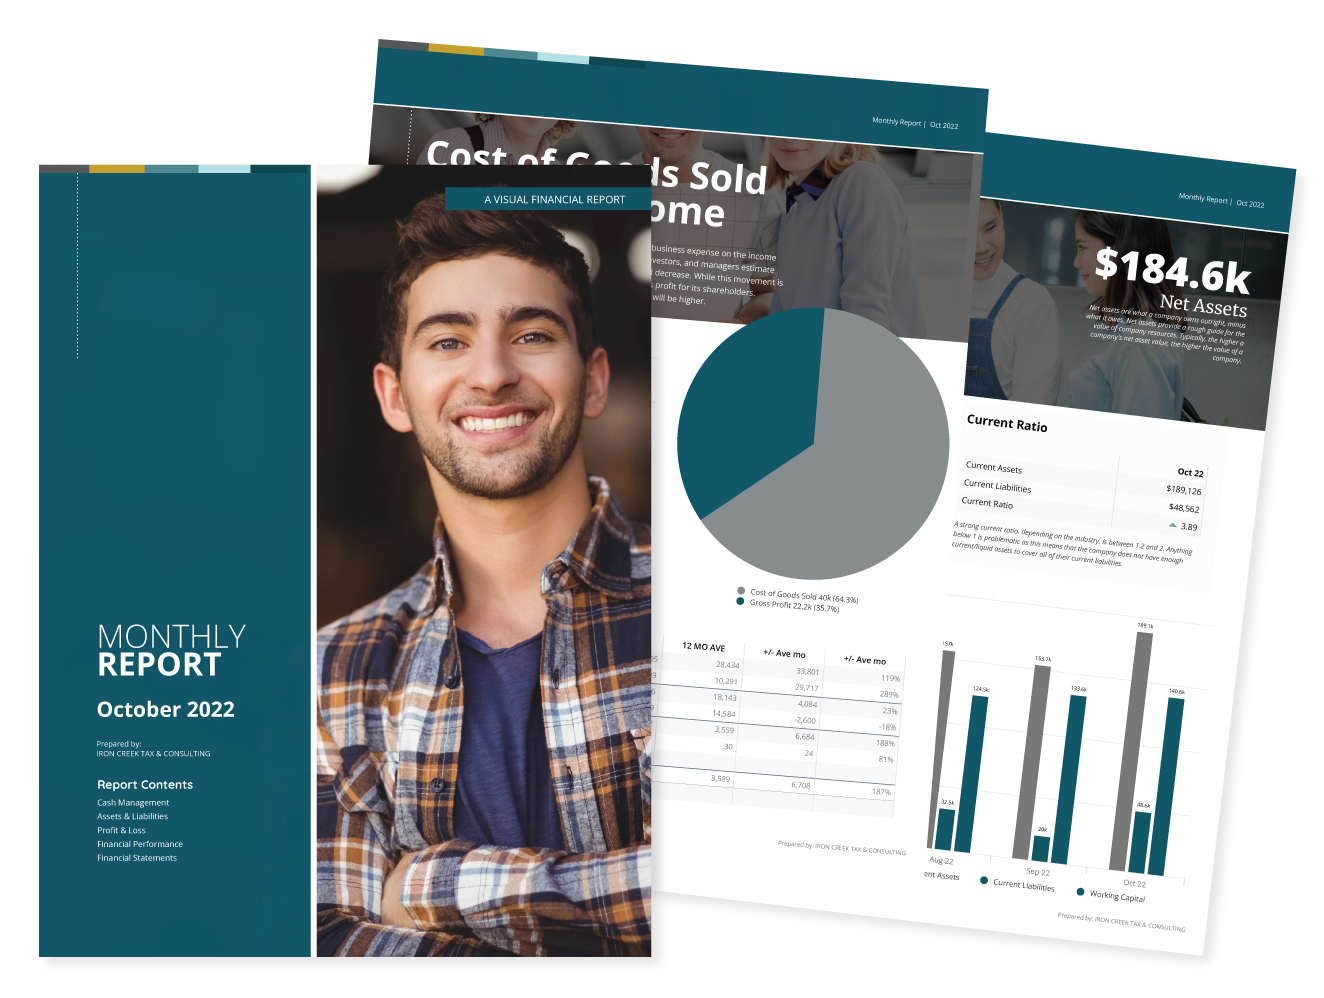
Powerful Visual Templates
Reports built on visual philosophy strategy.

What do you want to see? Use the pre-built dashboards and reports or build something truly custom. Want to show the relationship between the cash on hand and the expenses? What about marketing spend relative to the PPC revenue? Your ability to get granular data can spell the difference for clients and the managers that guide business.
Live, actionable, and beautiful data streams. Turn all your work into a template that will save you time.
Template Library
Our library is updated with new templates monthly providing a wide range of auto-populated reports, spreadsheets, metrics, and statements that help you quickly display actionable information.
Auto-populate
Add live text anywhere in your templates. Connect a company and the template will pull live data from your accounting software! Creating reports has never been this easy.
Share Custom Templates
Manage all your templated elements and share them with the company connections you manage. Reach isn’t just a report builder; it’s a financial storytelling system.
Build, Save and Manage
Build as many custom report, spreadsheet, or metric templates as you want. Quickly reuse them to jump-start new reports. Create custom spreadsheets with advanced formulas.
Automatic Color Branding
It is simple to change the template theme color to match your client’s brand. The entire template will change with the click of a button.
Providing the Most Training
We want our clients to get the most.
You are never alone with Reach Reporting. Our customer service is second to none. We provide access to training videos, newsletters, social, and so much more so you feel confident every step of the way.


